
Page 32 - Water Loss Control
P. 32
14 Cha pte r T w o
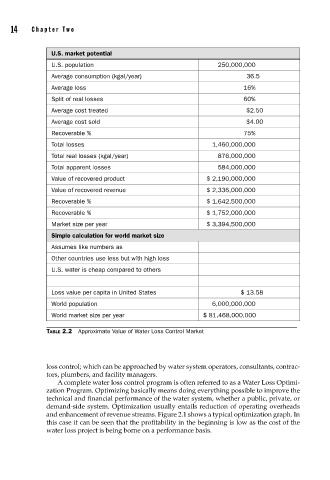
U.S. market potential
U.S. population 250,000,000
Average consumption (kgal/year) 36.5
Average loss 16%
Split of real losses 60%
Average cost treated $2.50
Average cost sold $4.00
Recoverable % 75%
Total losses 1,460,000,000
Total real losses (kgal/year) 876,000,000
Total apparent losses 584,000,000
Value of recovered product $ 2,190,000,000
Value of recovered revenue $ 2,336,000,000
Recoverable % $ 1,642,500,000
Recoverable % $ 1,752,000,000
Market size per year $ 3,394,500,000
Simple calculation for world market size
Assumes like numbers as
Other countries use less but with high loss
U.S. water is cheap compared to others
Loss value per capita in United States $ 13.58
World population 6,000,000,000
World market size per year $ 81,468,000,000
TABLE 2.2 Approximate Value of Water Loss Control Market
loss control; which can be approached by water system operators, consultants, contrac-
tors, plumbers, and facility managers.
A complete water loss control program is often referred to as a Water Loss Optimi-
zation Program. Optimizing basically means doing everything possible to improve the
technical and financial performance of the water system, whether a public, private, or
demand-side system. Optimization usually entails reduction of operating overheads
and enhancement of revenue streams. Figure 2.1 shows a typical optimization graph. In
this case it can be seen that the profitability in the beginning is low as the cost of the
water loss project is being borne on a performance basis.