
Page 242 - Water and Wastewater Engineering Design Principles and Practice
P. 242
COAGULATION AND FLOCCULATION 6-19
Jar test II
Jar numbers
1 2 3 4 5 6
pH 6.0 6.0 6.0 6.0 6.0 6.0
Alum dose (mg/L) 5 7 10 12 15 20
Turbidity (NTU) 14 9.5 5 4.5 6 13
Solution:
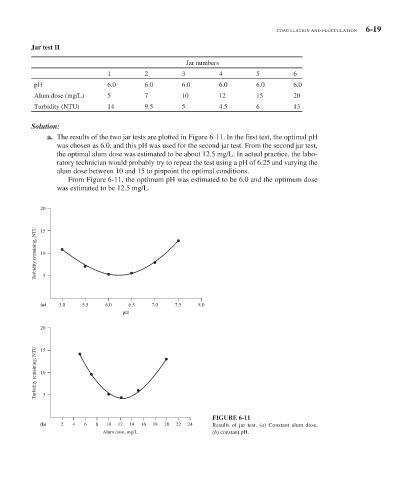
a. The results of the two jar tests are plotted in Figure 6-11 . In the first test, the optimal pH
was chosen as 6.0, and this pH was used for the second jar test. From the second jar test,
the optimal alum dose was estimated to be about 12.5 mg/L. In actual practice, the labo-
ratory technician would probably try to repeat the test using a pH of 6.25 and varying the
alum dose between 10 and 15 to pinpoint the optimal conditions.
From Figure 6-11 , the optimum pH was estimated to be 6.0 and the optimum dose
was estimated to be 12.5 mg/L.
20
Turbidity remaining, NTU 15 5
10
(a) 5.0 5.5 6.0 6.5 7.0 7.5 8.0
pH
20
Turbidity remaining, NTU 10 5
15
FIGURE 6-11
(b) 2 4 6 8 10 12 14 16 18 20 22 24 Results of jar test. (a) Constant alum dose,
Alum dose, mg/L (b) constant pH.