
Page 515 - Water and wastewater engineering
P. 515
13-10 WATER AND WASTEWATER ENGINEERING
Hypochlorite and ozone decay are modeled as a second order reaction (Gordon et al., 1995;
Gurol and Singer, 1982):
dC 2
kC
2 d (13-18)
dt
where k 2 d second order decay rate constant, L/mg · s
t time, s
Example 13-3. Using the following data adapted from Gurol and Singer (1982), estimate the
rate constant for ozone decay at a pH of 2.2.
Ozone concentration, mg/L Time, min
14.0 0
12.9 20
11.3 60
9.96 100
9.38 120
Solution:
a. Integration of Equation 13-18 yields
C 0
C t
d t C 0 )
1 ( k 2 )( )(
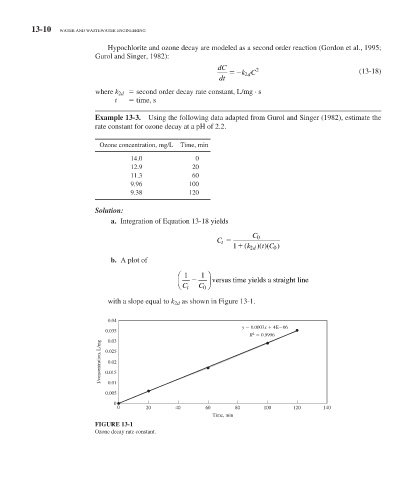
b. A plot of
⎛ 1 1 ⎞
⎜ ⎝ C t C ⎠ ⎟ versus time yields a straight lline
0
with a slope equal to k 2d as shown in Figure 13-1 .
0.04
y 0.0003x 4E 06
0.035
2
R 0.9996
0.03
1/concentration, L/mg 0.025
0.02
0.015
0.01
0.005
0
0 20 40 60 80 100 120 140
Time, min
FIGURE 13-1
Ozone decay rate constant.