
Page 85 - Water and wastewater engineering
P. 85
2-28 WATER AND WASTEWATER ENGINEERING
surface water is often highly variable in composition, more extensive time dependent data are
desirable.
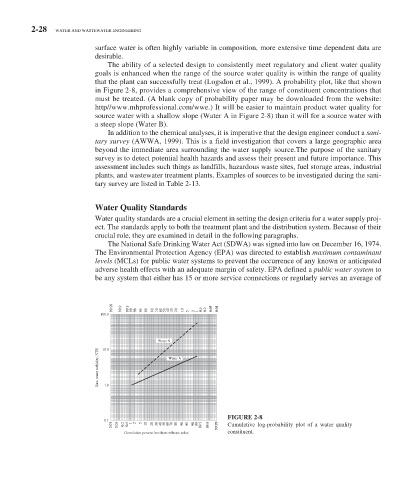
The ability of a selected design to consistently meet regulatory and client water quality
goals is enhanced when the range of the source water quality is within the range of quality
that the plant can successfully treat (Logsdon et al., 1999). A probability plot, like that shown
in Figure 2-8 , provides a comprehensive view of the range of constituent concentrations that
must be treated. (A blank copy of probability paper may be downloaded from the website:
http//www.mhprofessional.com/wwe .) It will be easier to maintain product water quality for
source water with a shallow slope (Water A in Figure 2-8 ) than it will for a source water with
a steep slope (Water B).
In addition to the chemical analyses, it is imperative that the design engineer conduct a sani-
tary survey (AWWA, 1999). This is a field investigation that covers a large geographic area
beyond the immediate area surrounding the water supply source.The purpose of the sanitary
survey is to detect potential health hazards and assess their present and future importance. This
assessment includes such things as landfills, hazardous waste sites, fuel storage areas, industrial
plants, and wastewater treatment plants. Examples of sources to be investigated during the sani-
tary survey are listed in Table 2-13 .
Water Quality Standards
Water quality standards are a crucial element in setting the design criteria for a water supply proj-
ect. The standards apply to both the treatment plant and the distribution system. Because of their
crucial role, they are examined in detail in the following paragraphs.
The National Safe Drinking Water Act (SDWA) was signed into law on December 16, 1974.
The Environmental Protection Agency (EPA) was directed to establish maximum contaminant
levels (MCLs) for public water systems to prevent the occurrence of any known or anticipated
adverse health effects with an adequate margin of safety. EPA defined a public water system to
be any system that either has 15 or more service connections or regularly serves an average of
99.99 99.9 99.5 99 98 95 90 80 70 60 50 40 30 20 10 0.5 0.2 0.05 0.01
100.0 5 2 1
Water B
10.0
Raw water turbidity, NTU 1.0 Water A
FIGURE 2-8
0.1
0.01 0.05 0.2 0.5 1 2 5 10 20 30 40 50 60 70 80 90 95 98 99 99.5 99.9 99.99 Cumulative log-probability plot of a water quality
Cumulative percent less than ordinate value constituent.