
Page 132 - Well Logging and Formation Evaluation
P. 132
122 Well Logging and Formation Evaluation
Following the same logic through as before, the EMV is:
+
+
DEMV = (R* ( 0.3*700 0.7*500) + (1 - R * 0.3*650 0.7*400) - .5 )
0
) (
- ( .*0 3 650 + . *0 7 500 ).
(8.2)
For the case in which R = 0.5 (50% probability of being correct):
-
DEMV = 517 545 = -28
Hence, your decision to undertake NMR logging has cost the company
$28 million!
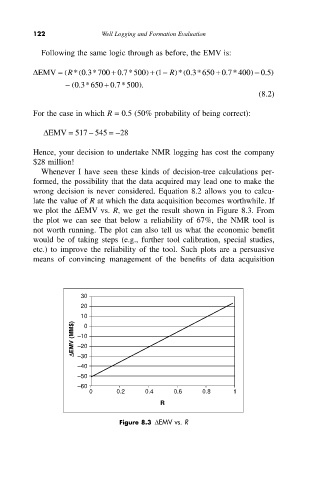
Whenever I have seen these kinds of decision-tree calculations per-
formed, the possibility that the data acquired may lead one to make the
wrong decision is never considered. Equation 8.2 allows you to calcu-
late the value of R at which the data acquisition becomes worthwhile. If
we plot the DEMV vs. R, we get the result shown in Figure 8.3. From
the plot we can see that below a reliability of 67%, the NMR tool is
not worth running. The plot can also tell us what the economic benefit
would be of taking steps (e.g., further tool calibration, special studies,
etc.) to improve the reliability of the tool. Such plots are a persuasive
means of convincing management of the benefits of data acquisition
30
20
10 0
DEMV (MM$) –10
–20
–30
–40
–50
–60
0 0.2 0.4 0.6 0.8 1
R
Figure 8.3 DEMV vs. R