
Page 61 - Well Logging and Formation Evaluation
P. 61
Full Interpretation 51
3
2.9
2.8
2.7 log data
Density (g/cc) 2.5 model
2.6
GRsa
GRsh
2.4
2.3 cutoff point
2.2
2.1
2
0 50 100 150
GR (API)
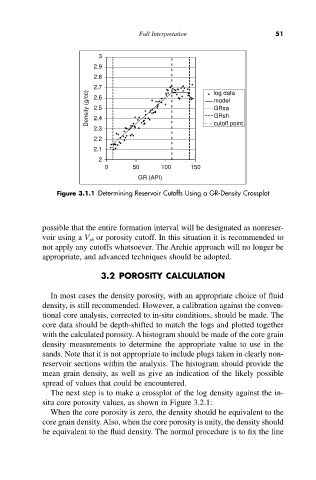
Figure 3.1.1 Determining Reservoir Cutoffs Using a GR-Density Crossplot
possible that the entire formation interval will be designated as nonreser-
voir using a V sh or porosity cutoff. In this situation it is recommended to
not apply any cutoffs whatsoever. The Archie approach will no longer be
appropriate, and advanced techniques should be adopted.
3.2 POROSITY CALCULATION
In most cases the density porosity, with an appropriate choice of fluid
density, is still recommended. However, a calibration against the conven-
tional core analysis, corrected to in-situ conditions, should be made. The
core data should be depth-shifted to match the logs and plotted together
with the calculated porosity. A histogram should be made of the core grain
density measurements to determine the appropriate value to use in the
sands. Note that it is not appropriate to include plugs taken in clearly non-
reservoir sections within the analysis. The histogram should provide the
mean grain density, as well as give an indication of the likely possible
spread of values that could be encountered.
The next step is to make a crossplot of the log density against the in-
situ core porosity values, as shown in Figure 3.2.1:
When the core porosity is zero, the density should be equivalent to the
core grain density. Also, when the core porosity is unity, the density should
be equivalent to the fluid density. The normal procedure is to fix the line