
Page 79 - Well Logging and Formation Evaluation
P. 79
Advanced Log Interpretation Techniques 69
In effect this equation makes the assumption that there is a “clean poros-
ity” (f c ) and that reduction in the measured porosity is as a result of dis-
persed clay. The excess conductivity BQ v is assumed to be related to this
proportional porosity reduction via the constant C.
If equation 5.1.3 is inserted into equation 5.1.1 and S w is set to 1 (for
water sands), the equation may be rearranged as:
C wa = f - m* R t = 1 R w +(f c C) ( f - f c ) (5.1.5)
1
*
1
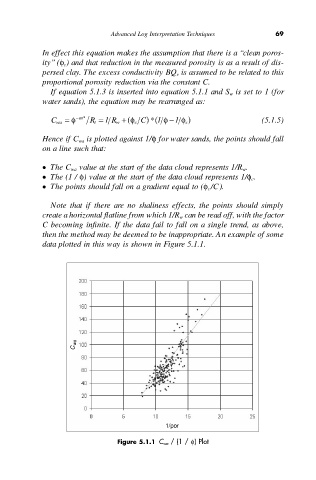
Hence if C wa is plotted against 1/f for water sands, the points should fall
on a line such that:
• The C wa value at the start of the data cloud represents 1/R w.
• The (1 / f) value at the start of the data cloud represents 1/f c .
• The points should fall on a gradient equal to (f c /C).
Note that if there are no shaliness effects, the points should simply
create a horizontal flatline from which 1/R w can be read off, with the factor
C becoming infinite. If the data fail to fall on a single trend, as above,
then the method may be deemed to be inappropriate. An example of some
data plotted in this way is shown in Figure 5.1.1.
C wa
1/por
Figure 5.1.1 C wa / (1 / f) Plot