
Page 277 - Whole Earth Geophysics An Introductory Textbook For Geologists And Geophysicists
P. 277
233
:
—— 1
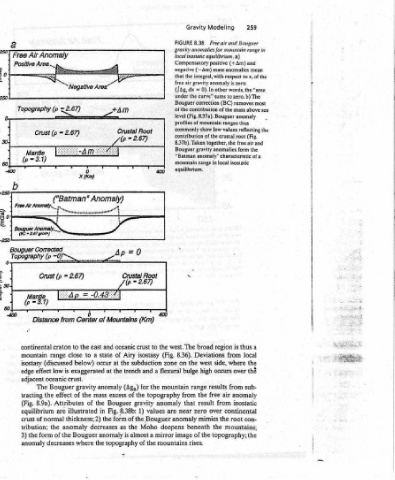
259 range in and (+Am) to x, of the (BC) removes most of the mass above sea (Fig. root free air and isostatic a thus is local the where the over sub- anomaly isostatic continental con- root mountains;
Modeling Free air and Bouguer gravity anomalies for mountain (—Am) mass anomalies mean respect air gravity anomaly is zero 0). In other words, the “area curve” sums to zero. b) The (Fig. 8.37a). Bouguer anomaly ranges thus commonly show low values reflecting the crustal of the together, the Bouguer gravity anomalies form the anomaly” characteristic of a local region from Deviations side, occurs from
Gravity 8.38 local isostatic equilibrium. a) Compensatory positive integral, with = Bouguer correction of the contribution profiles of mountain range in = broad west the high bulge range the result zero mimics beneath the of rises.
FIGURE negative the that free ({4g, dx under the leve} contribution 8.37b), Taken “Batman mountain equilibrium. ° west. The 8.36). on mountain from that near are anomaly deepens image mountains
400 t 400 the to (Fig. isostasy zone flexural and a the topography anomaly values of the Bouguer Moho mirror a the
Crustal Root = 2.67) Se =0 Ap Crustal Root 287) Je TF T (Km Cae) oceanic crust Airy of subduction the at trench the for (Ag,) the of excess gravity Bouguer 1) 8.38b: Fig. form the as almost is of topography
X (Km) = 2.67) T from the to close below) gravity the of Attributes illustrated thickness; 2) anomaly Bouguer where
0 ("Batman" Anomaly) T T 0 Center of Mountains and east state a to occur at exaggerated anomaly mass the of in the decreases anomaly the
Air Anomaly Free Alr Anomaly “OS y (p Crust (p fren, - istance os craton continental range mountain (discussed is low effect oceanic crust. Bouguer The effect the 8.9a). are equilibrium of normal the tribution; the of form decreases
Free Baiguel Anomaly Rouge Cr Topo i isostasy edge adjacent tracting (Fig. crust the 3) anomaly
a ; } 60. 00 Ml
*20T 60 : (eo) 3 as § = ol §
Aeuiouy AYABID
to
Crustal Root fe = 267) sharp increase. more gradual effects due the deep effect the for sources and how- of the val- 1) the because curve western classic (Fig. 8.38a). topography thickness
Gradient gives a has edge that range. (Ag,,) deep and continent edge effects, some 8.38a): equals occur the under across shows high normal
_— Gentle eee — ( Fig. 8.36). a) A root of crustal isostatic equilibrium is very broad. so values over the anomaly shallow thickness shows illustrates (Fig. topography effects area the anomalies profile isostatic equilibrium the as
Root Contribution (Km) range positive gravity the normal It often range isostatic equilibrium the of edge gradients; 3) gravity anomaly km), beneath mountains,
b rn Mass deficit local in Unless the “ 3 air from mountains. (+Am) significant free gravity to local 60 the
+250 | 30 Center of Mountains range mountain deep (b) contributions. air anomaly has significant free the model, contributions the over the of part mountain a for in Jocal excess 2) root; different modeled free air is close (~ thick flanks crust
Isostasy and Gravity 5 Distance from Contributions 10 gravity for mountain range in Airy isostatic equilibrium mass excess of topography. b) from air gravity anomaly profile for a free amplitude, the margin passive sum the is the of zero is anomaly The the over central range. the of flanks anomaly gravity air region a of properties mass the because zero of
é
Chapter 8 J. § amplitude. results free differing gradients of the shallow (a) and approaches full the in As range mountain 8.37c). (Fig. zero approaches along ever, the free The fundamental near are ues deficit mass deep and shallow anomaly the Fig. 8.39 America. South edge effects, suggesting that shows model The Andes the
258 ‘ 8.37 full nearly decrease. c) The root of of
8
< jon FIGURE of the
UOPAGGALOD AYABID) with the