
Page 32 - Wind Energy Handbook
P. 32
6 INTRODUCTION
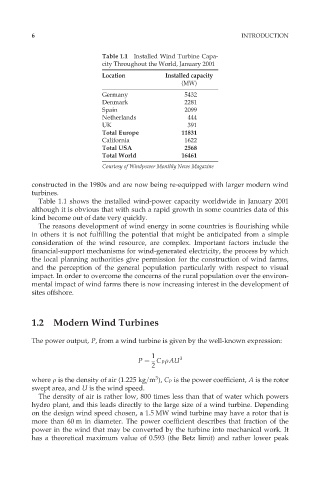
Table 1.1 Installed Wind Turbine Capa-
city Throughout the World, January 2001
Location Installed capacity
(MW)
Germany 5432
Denmark 2281
Spain 2099
Netherlands 444
UK 391
Total Europe 11831
California 1622
Total USA 2568
Total World 16461
Courtesy of Windpower Monthly News Magazine
constructed in the 1980s and are now being re-equipped with larger modern wind
turbines.
Table 1.1 shows the installed wind-power capacity worldwide in January 2001
although it is obvious that with such a rapid growth in some countries data of this
kind become out of date very quickly.
The reasons development of wind energy in some countries is flourishing while
in others it is not fulfilling the potential that might be anticipated from a simple
consideration of the wind resource, are complex. Important factors include the
financial-support mechanisms for wind-generated electricity, the process by which
the local planning authorities give permission for the construction of wind farms,
and the perception of the general population particularly with respect to visual
impact. In order to overcome the concerns of the rural population over the environ-
mental impact of wind farms there is now increasing interest in the development of
sites offshore.
1.2 Modern Wind Turbines
The power output, P, from a wind turbine is given by the well-known expression:
1 3
P ¼ C P rAU
2
3
where r is the density of air (1:225 kg=m ), C P is the power coefficient, A is the rotor
swept area, and U is the wind speed.
The density of air is rather low, 800 times less than that of water which powers
hydro plant, and this leads directly to the large size of a wind turbine. Depending
on the design wind speed chosen, a 1.5 MW wind turbine may have a rotor that is
more than 60 m in diameter. The power coefficient describes that fraction of the
power in the wind that may be converted by the turbine into mechanical work. It
has a theoretical maximum value of 0.593 (the Betz limit) and rather lower peak