
Page 52 - Wind Energy Handbook
P. 52
26 THE WIND RESOURCE
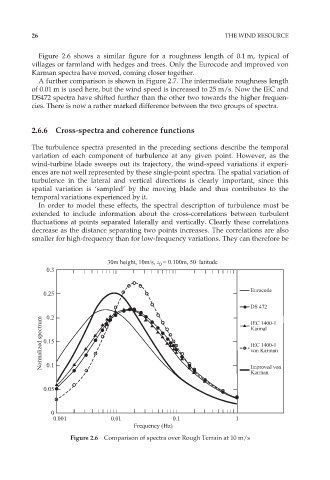
Figure 2.6 shows a similar figure for a roughness length of 0.1 m, typical of
villages or farmland with hedges and trees. Only the Eurocode and improved von
Karman spectra have moved, coming closer together.
A further comparison is shown in Figure 2.7. The intermediate roughness length
of 0.01 m is used here, but the wind speed is increased to 25 m/s. Now the IEC and
DS472 spectra have shifted further than the other two towards the higher frequen-
cies. There is now a rather marked difference between the two groups of spectra.
2.6.6 Cross-spectra and coherence functions
The turbulence spectra presented in the preceding sections describe the temporal
variation of each component of turbulence at any given point. However, as the
wind-turbine blade sweeps out its trajectory, the wind-speed variations it experi-
ences are not well represented by these single-point spectra. The spatial variation of
turbulence in the lateral and vertical directions is clearly important, since this
spatial variation is ‘sampled’ by the moving blade and thus contributes to the
temporal variations experienced by it.
In order to model these effects, the spectral description of turbulence must be
extended to include information about the cross-correlations between turbulent
fluctuations at points separated laterally and vertically. Clearly these correlations
decrease as the distance separating two points increases. The correlations are also
smaller for high-frequency than for low-frequency variations. They can therefore be
30m height, 10m/s, z = 0.100m, 50 latitude
0
0.3
Eurocode
0.25
DS 472
0.2
Normalized spectrum 0.15 Kaimal
IEC 1400-1
IEC 1400-1
von Karman
0.1
Improved von
Karman
0.05
0
0.001 0.01 0.1 1
Frequency (Hz)
Figure 2.6 Comparison of spectra over Rough Terrain at 10 m/s