
Page 130 - Characterization and Properties of Petroleum Fractions - M.R. Riazi
P. 130
QC: IML/FFX
T1: IML
P2: IML/FFX
P1: IML/FFX
AT029-Manual
June 22, 2007
AT029-Manual-v7.cls
AT029-03
110 CHARACTERIZATION AND PROPERTIES OF PETROLEUM FRACTIONS
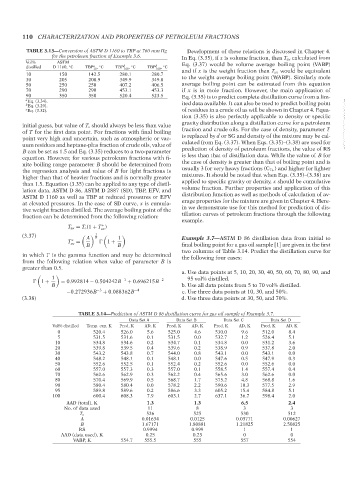
TABLE 3.13—Conversion of ASTM D 1160 to TBP at 760 mm Hg
Development of these relations is discussed in Chapter 4.
for the petroleum fraction of Example 3.6. 14:23 In Eq. (3.35), if x is volume fraction, then T av calculated from
Vol% ASTM Eq. (3.37) would be volume average boiling point (VABP)
a
distilled D 1160, C TBP , C TBP b 760 , C TBP b 760 , C and if x is the weight fraction then T av would be equivalent
◦
◦
◦
◦
10
10 150 142.5 280.1 280.7
30 205 200.9 349.9 349.0 to the weight average boiling point (WABP). Similarly mole
50 250 250 407.2 406.5 average boiling point can be estimated from this equation
70 290 290 453.1 453.3 if x is in mole fraction. However, the main application of
90 350 350 520.4 523.5 Eq. (3.35) is to predict complete distillation curve from a lim-
a Eq. (3.34).
b Eq. (3.29). ited data available. It can also be used to predict boiling point
c Eq. (3.32). of residues in a crude oil as will be shown in Chapter 4. Equa-
tion (3.35) is also perfectly applicable to density or specific
gravity distribution along a distillation curve for a petroleum
initial guess, but value of T ◦ should always be less than value --`,```,`,``````,`,````,```,,-`-`,,`,,`,`,,`---
of T for the first data point. For fractions with final boiling fraction and crude oils. For the case of density, parameter T
point very high and uncertain, such as atmospheric or vac- is replaced by d or SG and density of the mixture may be cal-
uum residues and heptane-plus fraction of crude oils, value of culated from Eq. (3.37). When Eqs. (3.35)–(3.38) are used for
B can be set as 1.5 and Eq. (3.35) reduces to a two-parameter prediction of density of petroleum fractions, the value of RS
equation. However, for various petroleum fractions with fi- is less than that of distillation data. While the value of B for
nite boiling range parameter B should be determined from the case of density is greater than that of boiling point and is
the regression analysis and value of B for light fractions is usually 3 for very heavy fractions (C 7+ ) and higher for lighter
higher than that of heavier fractions and is normally greater mixtures. It should be noted that when Eqs. (3.35)–(3.38) are
than 1.5. Equation (3.35) can be applied to any type of distil- applied to specific gravity or density, x should be cumulative
lation data, ASTM D 86, ASTM D 2887 (SD), TBP, EFV, and volume fraction. Further properties and application of this
ASTM D 1160 as well as TBP at reduced pressures or EFV distribution function as well as methods of calculation of av-
at elevated pressures. In the case of SD curve, x is cumula- erage properties for the mixture are given in Chapter 4. Here-
tive weight fraction distilled. The average boiling point of the in we demonstrate use for this method for prediction of dis-
fraction can be determined from the following relation: tillation curves of petroleum fractions through the following
example.
T av = T ◦ (1 + T )
∗
av
(3.37) A 1 B 1 Example 3.7—ASTM D 86 distillation data from initial to
∗
T = 1 +
av B B final boiling point for a gas oil sample [1] are given in the first
two columns of Table 3.14. Predict the distillation curve for
in which is the gamma function and may be determined the following four cases:
from the following relation when value of parameter B is
greater than 0.5.
a. Use data points at 5, 10, 20, 30, 40, 50, 60, 70, 80, 90, and
1 −1 −2 95 vol% distilled.
1 + = 0.992814 − 0.504242B + 0.696215B
B b. Use all data points from 5 to 70 vol% distilled.
−0.272936B −3 + 0.088362B −4 c. Use three data points at 10, 30, and 50%.
(3.38) d. Use three data points at 30, 50, and 70%.
TABLE 3.14—Prediction of ASTM D 86 distillation curve for gas oil sample of Example 3.7.
Data Set A Data Set B Data Set C Data Set D
Vol% distilled Temp. exp, K Pred, K AD, K Pred, K AD, K Pred, K AD, K Pred, K AD, K
0 520.4 526.0 5.6 525.0 4.6 530.0 9.6 512.0 8.4
5 531.5 531.6 0.1 531.5 0.0 532.7 1.2 526.4 5.1
10 534.8 534.6 0.2 534.7 0.1 534.8 0.0 531.2 3.6
20 539.8 539.5 0.4 539.6 0.2 538.9 0.9 537.8 2.0
30 543.2 543.8 0.7 544.0 0.8 543.1 0.0 543.1 0.0
40 548.2 548.1 0.1 548.1 0.0 547.6 0.5 547.9 0.3
50 552.6 552.5 0.1 552.4 0.2 552.6 0.0 552.6 0.0
60 557.0 557.3 0.3 557.0 0.1 558.5 1.4 557.4 0.4
70 562.6 562.9 0.3 562.2 0.4 565.6 3.0 562.6 0.0
80 570.4 569.9 0.5 568.7 1.7 575.2 4.8 568.8 1.6
90 580.4 580.4 0.0 578.2 2.2 590.6 10.3 577.5 2.9
95 589.8 589.6 0.2 586.6 3.3 605.2 15.4 584.8 5.1
100 600.4 608.3 7.9 603.1 2.7 637.1 36.7 598.4 2.0
AAD (total), K 1.3 1.3 6.5 2.4
No. of data used 11 8 3 3
T o 526 525 530 512
A 0.01634 0.0125 0.03771 0.00627
B 1.67171 1.80881 1.21825 2.50825
RS 0.9994 0.999 1 1
AAD (data used), K 0.25 0.23 0 0
VABP, K 554.7 555.5 555 557 554
Copyright ASTM International
Provided by IHS Markit under license with ASTM Licensee=International Dealers Demo/2222333001, User=Anggiansah, Erick
No reproduction or networking permitted without license from IHS Not for Resale, 08/26/2021 21:56:35 MDT