
Page 168 - Characterization and Properties of Petroleum Fractions - M.R. Riazi
P. 168
QC: IML/FFX
P2: IML/FFX
P1: IML/FFX
AT029-Manual
AT029-03
June 22, 2007
AT029-Manual-v7.cls
148 CHARACTERIZATION AND PROPERTIES OF PETROLEUM FRACTIONS
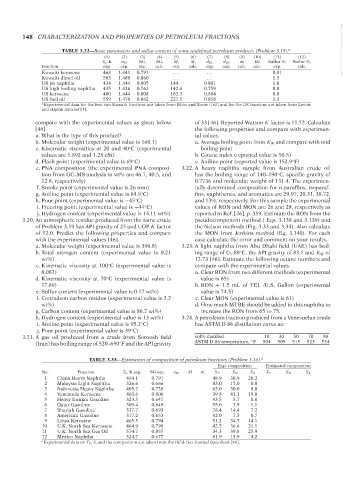
TABLE 3.32—Basic parameters and sulfur content of some undefined petroleum products (Problem 3.15).
(2)
(1) T1: IML (3) (4) 14:23 (5) (6) (7) (8) (9) (10) (11) a (12) --`,```,`,``````,`,````,```,,-`-`,,`,,`,`,,`---
T b ,K n 20 SG, SG, M, M, d 20 , d 20 , m, RI Sulfur %, Sulfur %,
Fraction exp. exp. exp. calc. exp. calc. exp. calc. calc. calc. exp. calc.
Kuwaiti kerosene 468 1.441 0.791 . . . . . . 0.01
Kuwaiti diesel oil 583 1.480 0.860 . . . . . . 1.3
US jet naphtha 434 1.444 0.805 144 0.801 1.0
US high boiling naphtha 435 1.426 0.762 142.4 0.759 0.0
US kerosene 480 1.444 0.808 162.3 0.804 0.0
US fuel oil 559 1.478 0.862 227.5 0.858 1.3
a Experimental data for the first two Kuwaiti fractions are taken from Riazi and Roomi [62] and for the US fractions are taken from Lenoir
and Hipkin data set [1].
compare with the experimental values as given below of 33 [46]. Reported Watson K factor is 11.72. Calculate
[46]. the following properties and compare with experimen-
a. What is the type of this product? tal values.
b. Molecular weight (experimental value is 160.1) a. Average boiling point from K W and compare with mid
c. Kinematic viscosities at 20 and 40 C (experimental boiling point
◦
values are 1.892 and 1.28 cSt) b. Cetane index (reported value is 50.5)
d. Flash point (experimental value is 69 C) c. Aniline point (reported value is 152.9 F)
◦
◦
e. PNA composition (the experimental PNA composi- 3.22. A heavy naphtha sample from Australian crude oil
tion from GC–MS analysis in wt% are 46.7, 40.5, and has the boiling range of 140–190 C, specific gravity of
◦
12.8, respectively) 0.7736 and molecular weight of 131.4. The experimen-
f. Smoke point (experimental value is 26 mm) tally determined composition for n-paraffins, isoparaf-
g. Aniline point (experimental value is 64.9 C) fins, naphthenes, and aromatics are 29.97, 20.31, 38.72,
◦
h. Pour point (experimental value is −45 C) and 13%, respectively. For this sample the experimental
◦
i. Freezing point (experimental value is −44 C) values of RON and MON are 26 and 28, respectively as
◦
j. Hydrogen content (experimental value is 14.11 wt%) reported in Ref. [46], p. 359. Estimate the RON from the
3.20. An atmospheric residue produced from the same crude pseudocomponent method ( Eqs. 3.138 and 3.139) and
of Problem 3.19 has API gravity of 25 and UOP K factor the Nelson methods (Fig. 3.33 and 3.34). Also calculate
of 12.0. Predict the following properties and compare the MON from Jenkins method (Eq. 3.140). For each
with the experimental values [46]. case calculate the error and comment on your results.
a. Molecular weight (experimental value is 399.8) 3.23. A light naphtha from Abu Dhabi field (UAE) has boil-
b. Total nitrogen content (experimental value is 0.21 ing range of C 5 -80 C, the API gravity of 83.1 and K W of
◦
wt%) 12.73 [46]. Estimate the following octane numbers and
c. Kinematic viscosity at 100 C (experimental value is compare with the experimental values.
◦
8.082) a. Clear RON from two different methods (experimental
d. Kinematic viscosity at 70 C (experimental value is value is 65)
◦
17.89) b. RON + 1.5 mL of TEL /U.S. Gallon (experimental
e. Sulfur content (experimental value is 0.17 wt%) value is 74.5)
f. Conradson carbon residue (experimental value is 2.2 c. Clear MON (experimental value is 61)
wt%) d. How much MTBE should be added to this naphtha to
g. Carbon content (experimental value is 86.7 wt%) increase the RON from 65 to 75.
h. Hydrogen content (experimental value is 13 wt%) 3.24. A petroleum fraction produced from a Venezuelan crude
i. Aniline point (experimental value is 95.2 C) has ASTM D 86 distillation curve as:
◦
j. Pour point (experimental value is 39 C)
◦
3.21. A gas oil produced from a crude from Soroosh field vol% distilled 10 30 50 70 90
◦
(Iran) has boiling range of 520–650 F and the API gravity ASTM D 86 temperature, F 504 509 515 523 534
◦
TABLE 3.33—Estimation of composition of petroleum fractions (Problem 3.16). a
Exp. composition Estimated composition
No. Fraction T b , K exp. SG exp. n 20 M m X P X N X A X P X N X A
1 China Heavy Naphtha 444.1 0.791 48.9 30.9 20.2
2 Malaysia Light Naphtha 326.6 0.666 83.0 17.0 0.0
3 Indonesia Heavy Naphtha 405.2 0.738 62.0 30.0 8.0
4 Venezuela Kerosene 463.6 0.806 39.8 41.1 19.0
5 Heavy Iranian Gasoline 323.5 0.647 93.5 5.7 0.8
6 Qatar Gasoline 309.4 0.649 95.0 3.9 1.1
7 Sharjah Gasoline 337.7 0.693 78.4 14.4 7.2
8 American Gasoline 317.2 0.653 92.0 7.3 0.7
9 Libya Kerosene 465.5 0.794 51.2 34.7 14.1
10 U.K. North Sea Kerosene 464.9 0.798 42.5 36.4 21.1
11 U.K. North Sea Gas Oil 574.7 0.855 34.3 39.8 25.9
12 Mexico Naphtha 324.7 0.677 81.9 13.9 4.2
a Experimental data on T b , S, and the composition are taken from the Oil & Gas Journal Data Book [46].
Copyright ASTM International
Provided by IHS Markit under license with ASTM Licensee=International Dealers Demo/2222333001, User=Anggiansah, Erick
No reproduction or networking permitted without license from IHS Not for Resale, 08/26/2021 21:56:35 MDT