
Page 318 - Mechanical Behavior of Materials
P. 318
Section 7.9 Additional Comments on Failure Criteria 319
150
1000 Solenhofen limestone 1013 MPa
Compressive Stress, MPa 600 405 MPa 608 MPa 811 MPa pressure 100 Stress, ksi
800
400
50
203 MPa
200
0.1 MPa
fracture
0
0 4 8 12 16 20 24
Compressive Strain, %
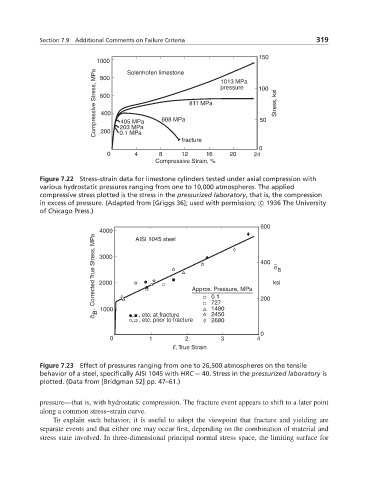
Figure 7.22 Stress–strain data for limestone cylinders tested under axial compression with
various hydrostatic pressures ranging from one to 10,000 atmospheres. The applied
compressive stress plotted is the stress in the pressurized laboratory, that is, the compression
in excess of pressure. (Adapted from [Griggs 36]; used with permission; c 1936 The University
of Chicago Press.)
600
4000 AISI 1045 steel
σ , Corrected T rue Stress, MPa 3000 Approx. Pressure, MPa 400 ksi B
∼
σ
2000
0.1
1480
2450
~ B 1000 , , etc: at fracture 727 200
, , etc: prior to fracture 2680
0
0 1 2 3 4
~
ε, True Strain
Figure 7.23 Effect of pressures ranging from one to 26,500 atmospheres on the tensile
behavior of a steel, specifically AISI 1045 with HRC = 40. Stress in the pressurized laboratory is
plotted. (Data from [Bridgman 52] pp. 47–61.)
pressure—that is, with hydrostatic compression. The fracture event appears to shift to a later point
along a common stress–strain curve.
To explain such behavior, it is useful to adopt the viewpoint that fracture and yielding are
separate events and that either one may occur first, depending on the combination of material and
stress state involved. In three-dimensional principal normal stress space, the limiting surface for