
Page 221 - Algae Anatomy, Biochemistry, and Biotechnology
P. 221
204 Algae: Anatomy, Biochemistry, and Biotechnology
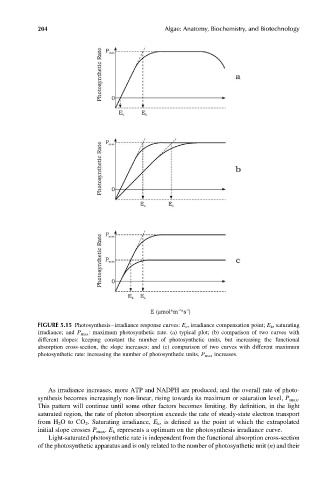
FIGURE 5.15 Photosynthesis–irradiance response curves: E c , irradiance compensation point; E k , saturating
irradiance; and P max : maximum photosynthetic rate. (a) typical plot; (b) comparison of two curves with
different slopes: keeping constant the number of photosynthetic units, but increasing the functional
absorption cross-section, the slope increases; and (c) comparison of two curves with different maximum
photosynthetic rate: increasing the number of photosynthetic units, P max increases.
As irradiance increases, more ATP and NADPH are produced, and the overall rate of photo-
synthesis becomes increasingly non-linear, rising towards its maximum or saturation level, P max .
This pattern will continue until some other factors becomes limiting. By definition, in the light
saturated region, the rate of photon absorption exceeds the rate of steady-state electron transport
from H 2 Oto CO 2 . Saturating irradiance, E k , is defined as the point at which the extrapolated
initial slope crosses P max . E k represents a optimum on the photosynthesis irradiance curve.
Light-saturated photosynthetic rate is independent from the functional absorption cross-section
of the photosynthetic apparatus and is only related to the number of photosynthetic unit (n) and their