
Page 233 - Introduction to Statistical Pattern Recognition
P. 233
5 Parameter Estimation 215
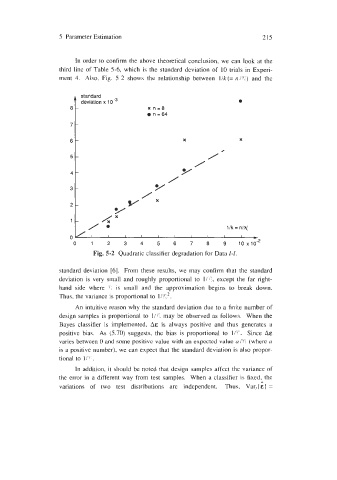
In order to confirm the above theoretical conclusion, we can look at the
third line of Table 5-6, which is the standard deviation of 10 trials in Experi-
ment 4. Also, Fig. 5-2 shows the relationship between l/k(= ~/TL) and the
A standard
deviation x 10 -3 0
8- x n=8
n=64
7-
6- X X
5- I'
/
4- t/
/
3- $/
./ vx
/
2-
4"
I -
1-
/ e Ilk = n/N
o/ I I I I I I I I I
Fig. 5-2 Quadratic classifier degradation for Data I-/.
standard deviation [6]. From these results, we may confirm that the standard
deviation is very small and roughly proportional to I/?,, except the far right-
hand side where 77, is small and the approximation begins to break down.
Thus, the variance is proportional to 1K2.
An intuitive reason why the standard deviation due to a finite number of
design samples is proportional to l/r, may be observed as follows. When the
Bayes classifier is implemented, A& is always positive and thus generates a
positive bias. As (5.70) suggests, the bias is proportional to I/'C Since A&
varies between 0 and some positive value with an expected value u/? (where Q
is a positive number), we can expect that the standard deviation is also propor-
tional to 1P:.
In addition, it should be noted that design samples affect the variance of
,.
the error in a different way from test samples. When a classifier is fixed, the
variations of two test distributions are independent. Thus, Var, ( E] =