
Page 230 - Introduction to Statistical Pattern Recognition
P. 230
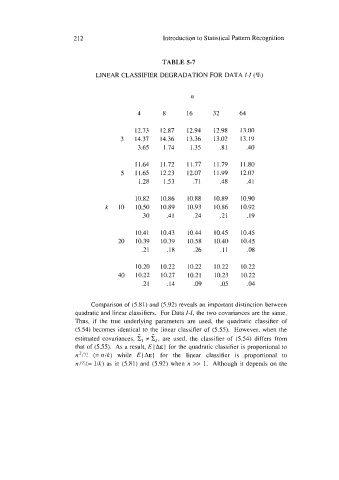
212                        Introduction to Statistical Pattern Recognition


                                                  TABLE 5-7

                              LINEAR CLASSIFIER DEGRADATION FOR DATA I-I (%)


                                                           n

                                           4       8      16      32      64

                                          12.73   12.87   12.94   12.98   13.00
                                      3   14.37   14.36   13.36   13.02   13.19
                                           3.65    1.74    1.35     .8 1    .40

                                          11.64   11.72   11.77   1 1.79   1.80
                                      5   11.65   12.23   12.07   11.99    2.07
                                           1.28    1.53     .7 1    .48     .4  1

                                          10.82   10.86   10.88   10.89    0.90
                                 k   10   10.50   10.89   10.93   10.86   10.92
                                            .30     .4  1   -24     .2 1    .I9


                                          10.4 1   10.43   10.44   10.45   10.45
                                     20   10.39   10.39   10.58   10.40   10.45
                                            .21     .18     .26     .11     .08

                                          10.20   10.22   10.22   10.22   10.22
                                     40   10.22   10.27   10.21   10.23   10.22
                                            .2  1   .I4     .09     .05     -04


                             Comparison of (5.8 1) and (5.92) reveals an  important distinction between
                        quadratic and linear classifiers.  For Data 1-1, the two covariances are the same.
                        Thus, if  the  true  underlying parameters are  used,  the  quadratic classifier of
                        (5.54)  becomes identical to the linear classifier of  (5.55).  However, when  the
                                           a   n
                        estimated covariances, I:, f Cz, are used, the  classifier of  (5.54) differs from
                        that of  (5.55).  As a result, E (A& 1 for the quadratic classifier is proportional to
                        n2/n (= nlk)  while  E{Aa)  for  the  linear  classifier  is  proportional  to
                        nl?I(=  Ilk) as in  (5.81) and (5.92) when  n  >>  1.  Although it depends on the