
Page 102 - Materials Chemistry, Second Edition
P. 102
86 3 Life Cycle Inventory Analysis
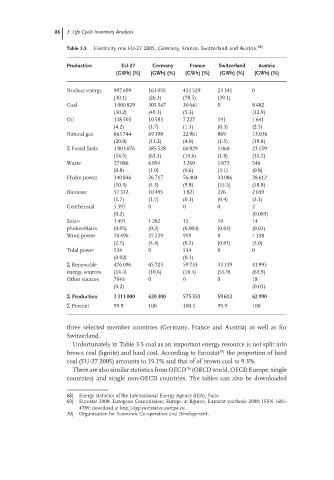
Table 3.5 Electricity mix EU-27 2005, Germany, France, Switzerland and Austria. 68)
Production EU-27 Germany France Switzerland Austria
(GWh) (%) (GWh) (%) (GWh) (%) (GWh) (%) (GWh) (%)
Nuclear energy 997 699 163 055 451 529 23 341 0
(30.1) (26.3) (78.5) (39.1)
Coal 1 000 829 305 547 30 641 0 8 482
(30.2) (49.3) (5.3) (12.9)
Oil 138 503 10 583 7 227 191 1 641
(4.2) (1.7) (1.3) (0.3) (2.5)
Natural gas 663 744 69 398 22 961 869 13.036
(20.0) (11.2) (4.0) (1.5) (19.8)
Σ Fossil fuels 1 803 076 385 528 60 829 1 060 23 159
(54.5) (62.1) (10.6) (1.8) (35.2)
Waste 27 086 6 094 3 260 1 872 546
(0.8) (1.0) (0.6) (3.1) (0.8)
Hydro power 340 846 26 717 56 404 33 086 38 612
(10.3) (4.3) (9.8) (55.5) (58.8)
Biomass 57 332 10 495 1 821 226 2 039
(1.7) (1.7) (0.3) (0.4) (3.1)
Geothermal 5 397 0 0 0 2
(0.2) (0.003)
Solar- 1 491 1 282 15 19 14
photovoltaics (0.05) (0.2) (0.003) (0.03) (0.02)
Wind power 70 496 27 229 959 8 1 328
(2.1) (4.4) (0.2) (0.01) (2.0)
Tidal power 534 0 534 0 0
(0.02) (0.1)
Σ Renewable 476 096 65 723 59 733 33 339 41 995
energy sources (14.4) (10.6) (10.4) (55.9) (63.9)
Other sources 7043 0 0 0 18
(0.2) (0.03)
Production 3 311 000 620 300 575 351 59 612 62 990
Σ Percent 99.9 100 100.1 99.9 100
three selected member countries (Germany, France and Austria) as well as for
Switzerland.
Unfortunately in Table 3.5 coal as an important energy resource is not split into
brown coal (lignite) and hard coal. According to Eurostat 69) the proportion of hard
coal (EU-27 2005) amounts to 19.1% and that of of brown coal to 9.3%.
There are also similar statistics from OECD (OECD world, OECD Europe, single
70)
countries) and single non-OECD countries. The tables can also be downloaded
68) Energy statistics of the International Energy Agency (IEA), Paris.
69) Eurostat 2008: European Commission: Europe in figures, Eurostat yearbook 2008; ISSN 1681-
4789; download at http://epp.eurostat.ec.europa.eu.
70) Organisation for Economic Co-operation and Development.