
Page 168 - Materials Chemistry, Second Edition
P. 168
152 3 Life Cycle Inventory Analysis
3.7.2.7 Transportation by Truck
No information on an average distribution distance is available for the
regarded filling materials. Quite an effort is necessary for the procurement of
more up-to-date and more representative data for beverage distribution and
this was not the subject of this study. As a substitute for all regarded beverage
packagings the distribution model from UBA-II for the filling ‘Beverages with-
out CO of the stockpile segment (>0.5 l)’ was adapted Plinke et al. (2000).
2
The average transportation distance is therefore approximately 350 km.
The data record is based on standard emission data, which are arranged,
validated, updated and evaluated in a ‘Handbook for Emission Factors’ INFRAS
(2004b) for the Federal Environmental Agency Berlin and the Federal Office for
Environment Protection BUWAL Bern.
All factors consider appropriate vehicle mix and the proportion of account-
able driven distance.
This handbook is an application of databases and supplies the fuel
consumption depending on driving performance plus emissions in the
categories truck classes, road types and utilisation ratios separately.
3.7.2.8 Electricity Supply
The balancing of electricity supply (electricity mix, power plant and electricity
distribution) by LCA is not only relevant concerning the use of resources but also
for the calculation of emissions into the air (see Section 3.2).
The electricity supply for processes within the German reference area were
assessed by the German mix of energy sources (Table 3.12). Processes
abroad are calculated according to the appropriate regional energy-mix,
if the aggregation level of the respective data records allowed a separate
modelling of the electricity supply.
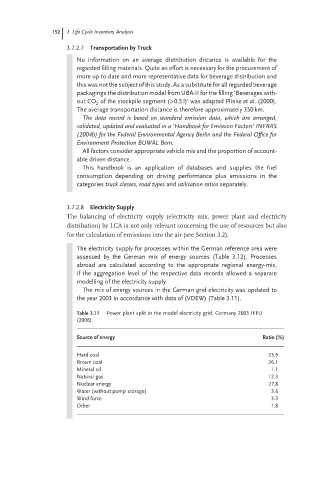
The mix of energy sources in the German grid electricity was updated to
the year 2003 in accordance with data of (VDEW) (Table 3.11).
Table 3.11 Power plant split in the model electricity grid, Germany 2003 IFEU
(2006).
Source of energy Ratio (%)
Hard coal 23.9
Brown coal 26.1
Mineral oil 1.1
Natural gas 12.3
Nuclear energy 27.8
Water (without pump storage) 3.6
Wind force 3.3
Other 1.8