
Page 175 - Materials Chemistry, Second Edition
P. 175
3.7 Illustration of the Inventory Phase by an Example 159
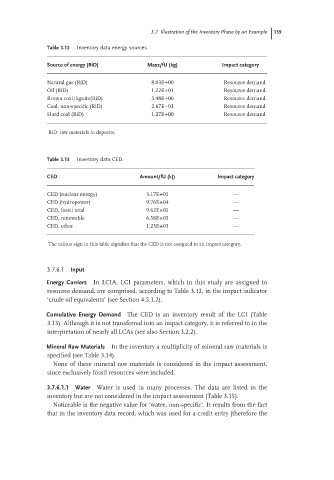
Table 3.12 Inventory data energy sources.
Source of energy (RiD) Mass/fU (kg) Impact category
Natural gas (RiD) 8.03E+00 Resource demand
Oil (RiD) 1.22E+01 Resource demand
Brown coal/lignite(RiD) 5.48E+00 Resource demand
Coal, non-specific (RiD) 2.67E–03 Resource demand
Hard coal (RiD) 1.27E+00 Resource demand
RiD: raw materials in deposits.
Table 3.13 Inventory data CED.
CED Amount/fU (kJ) Impact category
CED (nuclear energy) 3.17E+05 —
CED (hydropower) 9.76E+04 —
CED, fossil total 9.62E+05 —
CED, renewable 6.58E+05 —
CED, other 1.23E+03 —
The minus sign in this table signifies that the CED is not assigned to an impact category.
3.7.6.1 Input
Energy Carriers In LCIA, LCI parameters, which in this study are assigned to
resource demand, are comprised, according to Table 3.12, in the impact indicator
‘crude oil equivalents’ (see Section 4.5.1.2).
Cumulative Energy Demand The CED is an inventory result of the LCI (Table
3.13). Although it is not transferred into an impact category, it is referred to in the
interpretation of nearly all LCAs (see also Section 3.2.2).
Mineral Raw Materials In the inventory a multiplicity of mineral raw materials is
specified (see Table 3.14).
None of these mineral raw materials is considered in the impact assessment,
since exclusively fossil resources were included.
3.7.6.1.1 Water Water is used in many processes. The data are listed in the
inventory but are not considered in the impact assessment (Table 3.15).
Noticeable is the negative value for ‘water, non-specific’. It results from the fact
that in the inventory data record, which was used for a credit entry (therefore the