
Page 209 - Materials Chemistry, Second Edition
P. 209
4.3 Structure of Impact Assessment according to ISO 14040 and 14044 193
Example 1
Impact categories ‘climatic change’ and ‘stratospheric ozone depletion’ with
reference to an annually released mass of CO -equivalents in Germany (GWP – see
2
31)
Section 4.5.2.2) respectively R11 -equivalents (ozone depletion potential
(ODP) 32) – see Section 4.5.2.3): specific contribution 33)
The following results are obtained following a transformation of inventory data of
a fictitious product system: for the impact category ‘climatic change’ a category
indicator result of 500 kg CO -equivalents/fU (GWP = 500 kg) and for impact
2
category ‘stratospheric ozone depletion’ a category indicator result of 0.0000022 kg
R11 equivalents/fU (ODP = 2.2 × 10 −6 kg). The geographical system boundary is
Germany.
Normalisation of the category indicator result ‘CO -equivalents’:
2
• The category indicator result for an annual release of CO -equivalents in Germany
2
is 1 017 916 500 t (year of reference 2003 ). The selected reference year should
34)
correspond to the reference period of the study.
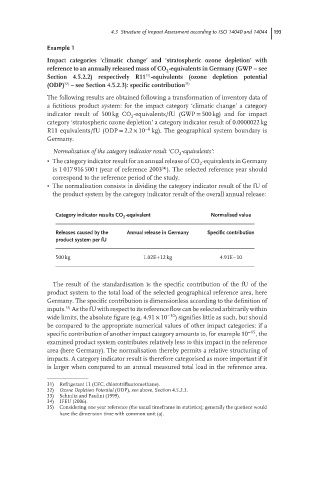
• The normalisation consists in dividing the category indicator result of the fU of
the product system by the category indicator result of the overall annual release:
Category indicator results CO -equivalent Normalised value
2
Releases caused by the Annual release in Germany Specific contribution
product system per fU
500 kg 1.02E+12 kg 4.91E−10
The result of the standardisation is the specific contribution of the fU of the
product system to the total load of the selected geographical reference area, here
Germany. The specific contribution is dimensionless according to the definition of
35)
inputs. As the fU with respect to its reference flow can be selected arbitrarily within
wide limits, the absolute figure (e.g. 4.91 × 10 −10 ) signifies little as such, but should
be compared to the appropriate numerical values of other impact categories: if a
specific contribution of another impact category amounts to, for example 10 −15 ,the
examined product system contributes relatively less to this impact in the reference
area (here Germany). The normalisation thereby permits a relative structuring of
impacts. A category indicator result is therefore categorised as more important if it
is larger when compared to an annual measured total load in the reference area.
31) Refrigerant 11 (CFC, chlorotrifluoromethane).
32) Ozone Depletion Potential (ODP), see above, Section 4.5.2.3.
33) Schmitz and Paulini (1999).
34) IFEU (2006).
35) Considering one year reference (the usual timeframe in statistics); generally the quotient would
have the dimension time with common unit (a).