
Page 196 - Materials Chemistry, Second Edition
P. 196
182 R.K. Rosenbaum et al.
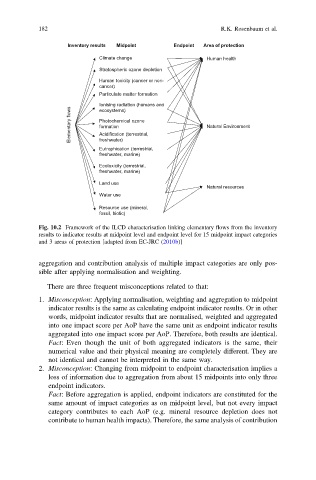
Inventory results Midpoint Endpoint Area of protection
Climate change Human health
Stratospheric ozone depletion
Human toxicity (cancer or non-
cancer)
Particulate matter formation
Ionising radiation (humans and
Elementary flows Photochemical ozone Natural Environment
ecosystems)
formation
Acidification (terrestrial,
freshwater)
Eutrophication (terrestrial,
freshwater, marine)
Ecotoxicity (terrestrial,
freshwater, marine)
Land use
Natural resources
Water use
Resource use (mineral,
fossil, biotic)
Fig. 10.2 Framework of the ILCD characterisation linking elementary flows from the inventory
results to indicator results at midpoint level and endpoint level for 15 midpoint impact categories
and 3 areas of protection [adapted from EC-JRC (2010b)]
aggregation and contribution analysis of multiple impact categories are only pos-
sible after applying normalisation and weighting.
There are three frequent misconceptions related to that:
1. Misconception: Applying normalisation, weighting and aggregation to midpoint
indicator results is the same as calculating endpoint indicator results. Or in other
words, midpoint indicator results that are normalised, weighted and aggregated
into one impact score per AoP have the same unit as endpoint indicator results
aggregated into one impact score per AoP. Therefore, both results are identical.
Fact: Even though the unit of both aggregated indicators is the same, their
numerical value and their physical meaning are completely different. They are
not identical and cannot be interpreted in the same way.
2. Misconception: Changing from midpoint to endpoint characterisation implies a
loss of information due to aggregation from about 15 midpoints into only three
endpoint indicators.
Fact: Before aggregation is applied, endpoint indicators are constituted for the
same amount of impact categories as on midpoint level, but not every impact
category contributes to each AoP (e.g. mineral resource depletion does not
contribute to human health impacts). Therefore, the same analysis of contribution