
Page 219 - Materials Chemistry, Second Edition
P. 219
10 Life Cycle Impact Assessment 205
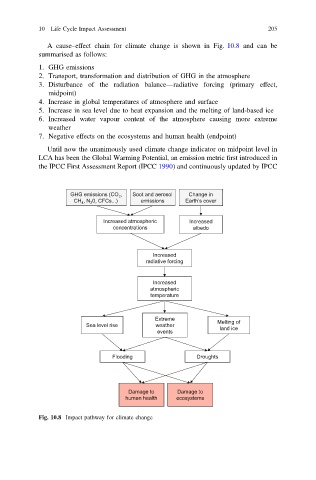
A cause–effect chain for climate change is shown in Fig. 10.8 and can be
summarised as follows:
1. GHG emissions
2. Transport, transformation and distribution of GHG in the atmosphere
3. Disturbance of the radiation balance—radiative forcing (primary effect,
midpoint)
4. Increase in global temperatures of atmosphere and surface
5. Increase in sea level due to heat expansion and the melting of land-based ice
6. Increased water vapour content of the atmosphere causing more extreme
weather
7. Negative effects on the ecosystems and human health (endpoint)
Until now the unanimously used climate change indicator on midpoint level in
LCA has been the Global Warming Potential, an emission metric first introduced in
the IPCC First Assessment Report (IPCC 1990) and continuously updated by IPCC
GHG emissions (CO 2 , Soot and aerosol Change in
CH 4 , N 2 0, CFCs...) emissions Earth’s cover
Increased atmospheric Increased
concentrations albedo
Increased
radiative forcing
Increased
atmospheric
temperature
Extreme Melting of
Sea level rise weather land ice
events
Flooding Droughts
Damage to Damage to
human health ecosystems
Fig. 10.8 Impact pathway for climate change