
Page 107 - Materials Chemistry, Second Edition
P. 107
90 Practical Design Calculations for Groundwater and Soil Remediation
Example 3.14: Analysis of Pumping Test Data Using
Cooper–Jacob’s Straight-Line Method
A pumping test (Q = 120 gpm) was conducted on a confined aquifer (aquifer
thickness = 30.0 ft). The time-drawdown data at a distance 150 ft away from
the well were collected and shown in the following table.
Use the Cooper–Jacob’s straight-line method to determine the hydraulic
conductivity and storativity of the aquifer.
Time Since Pumping Started, T (min) Drawdown, s (ft)
7 0.15
20 0.45
80 0.90
200 1.16
Solution:
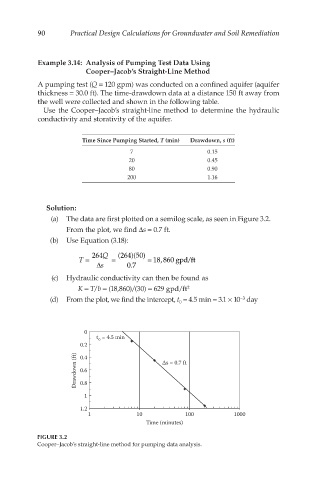
(a) The data are first plotted on a semilog scale, as seen in Figure 3.2.
From the plot, we find Δs = 0.7 ft.
(b) Use Equation (3.18):
264 Q (264)(50)
T = = = 18,860 gpd/ft
s ∆ 0.7
(c) Hydraulic conductivity can then be found as
K = T/b = (18,860)/(30) = 629 gpd/ft 2
(d) From the plot, we find the intercept, t = 4.5 min = 3.1 × 10 day
−3
0
0
t = 4.5 min
o
0.2
Drawdown (ft) 0.4 ∆s = 0.7 ft
0.6
0.8
1
1.2
1 10 100 1000
Time (minutes)
FIGURE 3.2
Cooper–Jacob’s straight-line method for pumping data analysis.