
Page 259 -
P. 259
OXIDATION AND DISINFECTION 1 0.5
0 10 20 30 40 50 T 60 70 80 90 1 oo
Time, min
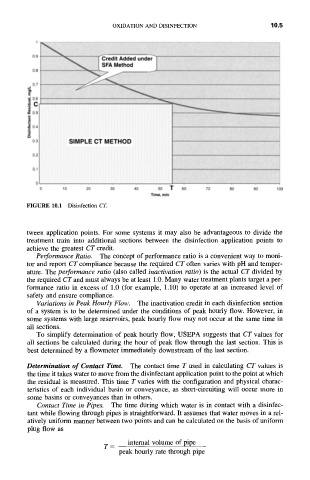
FIGURE 10.1 Disinfection CT.
tween application points. For some systems it may also be advantageous to divide the
treatment train into additional sections between the disinfection application points to
achieve the greatest CT credit.
Performance Ratio. The concept of performance ratio is a convenient way to moni-
tor and report CT compliance because the required CT often varies with pH and temper-
ature. The performance ratio (also called inactivation ratio) is the actual CT divided by
the required CT and must always be at least 1.0. Many water treatment plants target a per-
formance ratio in excess of 1.0 (for example, 1.10) to operate at an increased level of
safety and ensure compliance.
Variations in Peak Hourly Flow. The inactivation credit in each disinfection section
of a system is to be determined under the conditions of peak hourly flow. However, in
some systems with large reservoirs, peak hourly flow may not occur at the same time in
all sections.
To simplify determination of peak hourly flow, USEPA suggests that CT values for
all sections be calculated during the hour of peak flow through the last section. This is
best determined by a flowmeter immediately downstream of the last section.
Determination of Contact Time. The contact time T used in calculating CT values is
the time it takes water to move from the disinfectant application point to the point at which
the residual is measured. This time T varies with the configuration and physical charac-
teristics of each individual basin or conveyance, as short-circuiting will occur more in
some basins or conveyances than in others.
Contact Time in Pipes. The time during which water is in contact with a disinfec-
tant while flowing through pipes is straightforward. It assumes that water moves in a rel-
atively uniform manner between two points and can be calculated on the basis of uniform
plug flow as
internal volume of pipe
T =
peak hourly rate through pipe