
Page 260 -
P. 260
10.6 CHAPTER TEN
Contact Time through Reservoirs. Under most conditions, water does not move
through reservoirs, tanks, and basins in a uniform manner. Therefore the time T used to
compute CT in reservoirs depends on the design of the reservoir, such as the shape, inlet
and outlet design and locations, and the baffling. In general, reservoirs with a large length-
to-width ratio and with good inlet and outlet baffling minimize short-circuiting and pro-
vide the most uniform flow.
The contact time used to calculate the CT is the detention time at which 90% of the
water passing through the reservoir is retained within the reservoir--in other words, the
time it takes for 10% of the water to pass through the reservoir. This detention time, or
contact time, is designated as Tlo. The value of Tlo for a reservoir at various flow rates
may be determined experimentally by tracer studies or theoretically by approximation.
The most accurate method of determining contact time through reservoirs is by ex-
periments using tracer chemicals such as fluoride or lithium. The studies are performed
by feeding controlled amounts of the tracer chemical at the reservoir inlet and making re-
peated analyses of samples collected at the outlet. Unfortunately, both the contact time
and the detention time under various flow rates are not linear functions, so it is recom-
mended that tracer studies be performed using at least four flow rates that span the nor-
mal flow range. This information can then be used to construct a curve of detention time
versus flow rate that can be used to determine T~0 at any flow with fair accuracy.
Under certain conditions, the state primacy agency may allow the contact time for a
reservoir to be determined by an approximation. The method involves multiplying the the-
oretical contact time (plug flow) of a reservoir by a rule-of-thumb factor that takes into
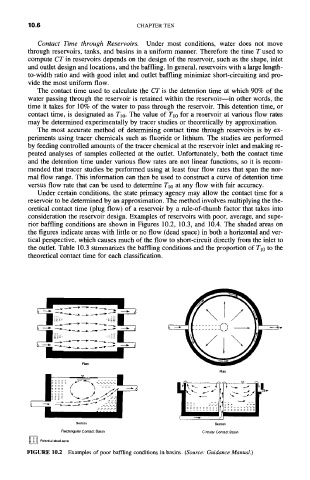
consideration the reservoir design. Examples of reservoirs with poor, average, and supe-
rior baffling conditions are shown in Figures 10.2, 10.3, and 10.4. The shaded areas on
the figures indicate areas with little or no flow (dead space) in both a horizontal and ver-
tical perspective, which causes much of the flow to short-circuit directly from the inlet to
the outlet. Table 10.3 summarizes the baffling conditions and the proportion of T10 to the
theoretical contact time for each classification.
Plan
Seclion
Section
Rectangular Contact Basin
Circular Contact Basin
] Potentia) dead zone
FIGURE 10.2 Examples of poor baffling conditions in basins. (Source." Guidance Manual.)