
Page 19 - A Comprehensive Guide to Solar Energy Systems
P. 19
Chapter 1 • Why Solar Energy? 11
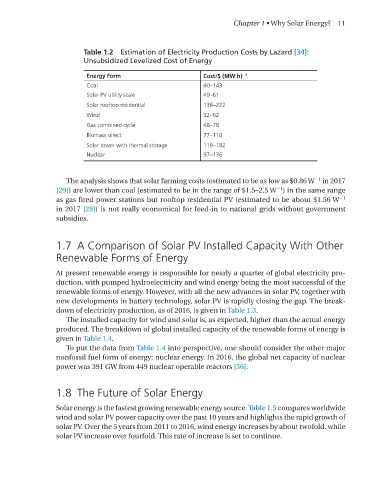
Table 1.2 Estimation of Electricity Production Costs by Lazard [34]:
Unsubsidized Levelized Cost of Energy
Energy Form Cost/$ (MW h) −1
Coal 60–143
Solar PV utility scale 49–61
Solar rooftop residential 138–222
Wind 32–62
Gas combined cycle 48–78
Biomass direct 77–110
Solar tower with thermal storage 119–182
Nuclear 97–136
−1
The analysis shows that solar farming costs (estimated to be as low as $0.86 W in 2017
−1
[29]) are lower than coal (estimated to be in the range of $1.5–2.5 W ) in the same range
−1
as gas fired power stations but rooftop residential PV (estimated to be about $1.56 W
in 2017 [29]) is not really economical for feed-in to national grids without government
subsidies.
1.7 A Comparison of Solar PV Installed Capacity With Other
Renewable Forms of Energy
At present renewable energy is responsible for nearly a quarter of global electricity pro-
duction, with pumped hydroelectricity and wind energy being the most successful of the
renewable forms of energy. However, with all the new advances in solar PV, together with
new developments in battery technology, solar PV is rapidly closing the gap. The break-
down of electricity production, as of 2016, is given in Table 1.3.
The installed capacity for wind and solar is, as expected, higher than the actual energy
produced. The breakdown of global installed capacity of the renewable forms of energy is
given in Table 1.4.
To put the data from Table 1.4 into perspective, one should consider the other major
nonfossil fuel form of energy: nuclear energy. In 2016, the global net capacity of nuclear
power was 391 GW from 449 nuclear operable reactors [36].
1.8 The Future of Solar Energy
Solar energy is the fastest growing renewable energy source. Table 1.5 compares worldwide
wind and solar PV power capacity over the past 10 years and highlights the rapid growth of
solar PV. over the 5 years from 2011 to 2016, wind energy increases by about twofold, while
solar PV increase over fourfold. This rate of increase is set to continue.