
Page 20 - A Comprehensive Guide to Solar Energy Systems
P. 20
12 A CoMPREHENSIVE GUIdE To SoLAR ENERGy SySTEMS
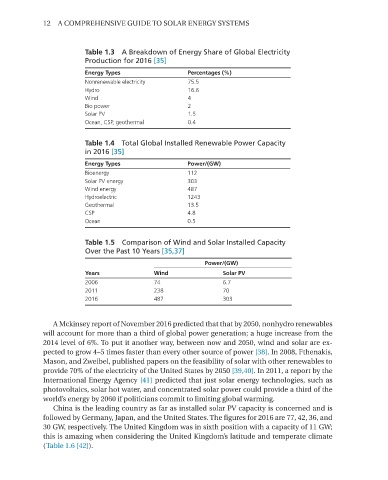
Table 1.3 A Breakdown of Energy Share of Global Electricity
Production for 2016 [35]
Energy Types Percentages (%)
Nonrenewable electricity 75.5
Hydro 16.6
Wind 4
Bio power 2
Solar PV 1.5
Ocean, CSP, geothermal 0.4
Table 1.4 Total Global Installed Renewable Power Capacity
in 2016 [35]
Energy Types Power/(GW)
Bioenergy 112
Solar PV energy 303
Wind energy 487
Hydroelectric 1243
Geothermal 13.5
CSP 4.8
Ocean 0.5
Table 1.5 Comparison of Wind and Solar Installed Capacity
Over the Past 10 Years [35,37]
Power/(GW)
Years Wind Solar PV
2006 74 6.7
2011 238 70
2016 487 303
A Mckinsey report of November 2016 predicted that that by 2050, nonhydro renewables
will account for more than a third of global power generation; a huge increase from the
2014 level of 6%. To put it another way, between now and 2050, wind and solar are ex-
pected to grow 4–5 times faster than every other source of power [38]. In 2008, Fthenakis,
Mason, and Zweibel, published papers on the feasibility of solar with other renewables to
provide 70% of the electricity of the United States by 2050 [39,40]. In 2011, a report by the
International Energy Agency [41] predicted that just solar energy technologies, such as
photovoltaics, solar hot water, and concentrated solar power could provide a third of the
world’s energy by 2060 if politicians commit to limiting global warming.
China is the leading country as far as installed solar PV capacity is concerned and is
followed by Germany, Japan, and the United States. The figures for 2016 are 77, 42, 36, and
30 GW, respectively. The United Kingdom was in sixth position with a capacity of 11 GW;
this is amazing when considering the United Kingdom’s latitude and temperate climate
(Table 1.6 [42]).