
Page 410 - A Comprehensive Guide to Solar Energy Systems
P. 410
Chapter 21 • (EROI) and (EPBT) for PVs 419
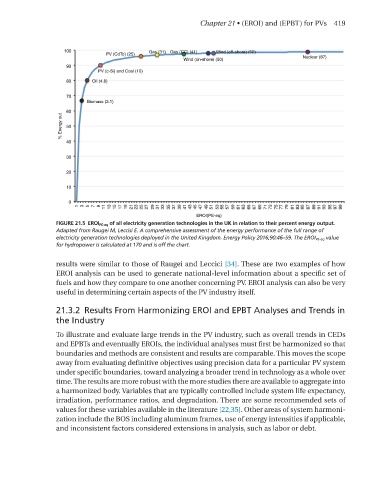
FIGURE 21.5 EROI PE-eq of all electricity generation technologies in the UK in relation to their percent energy output.
Adapted from Raugei M, Leccisi E. A comprehensive assessment of the energy performance of the full range of
electricity generation technologies deployed in the United Kingdom. Energy Policy 2016;90:46–59. The EROI PE-eq value
for hydropower is calculated at 170 and is off the chart.
results were similar to those of Raugei and Leccici [34]. These are two examples of how
EROI analysis can be used to generate nationallevel information about a specific set of
fuels and how they compare to one another concerning pv. EROI analysis can also be very
useful in determining certain aspects of the pv industry itself.
21.3.2 Results From Harmonizing EROI and EPBT Analyses and Trends in
the Industry
To illustrate and evaluate large trends in the pv industry, such as overall trends in CEDs
and EpBTs and eventually EROIs, the individual analyses must first be harmonized so that
boundaries and methods are consistent and results are comparable. This moves the scope
away from evaluating definitive objectives using precision data for a particular pv system
under specific boundaries, toward analyzing a broader trend in technology as a whole over
time. The results are more robust with the more studies there are available to aggregate into
a harmonized body. variables that are typically controlled include system life expectancy,
irradiation, performance ratios, and degradation. There are some recommended sets of
values for these variables available in the literature [22,35]. Other areas of system harmoni
zation include the BOS including aluminum frames, use of energy intensities if applicable,
and inconsistent factors considered extensions in analysis, such as labor or debt.