
Page 474 - A Comprehensive Guide to Solar Energy Systems
P. 474
Chapter 25 • Optimal Renewable Energy Systems 487
output actually obtained over the course of the year, perhaps 20% in the case of solar PV
(given nights and cloudy days, and depending on location). Based on Eq. (25.1), greater
CF clearly reduces lCoE: for given capital and operating costs, energy cost falls with more
energy production.
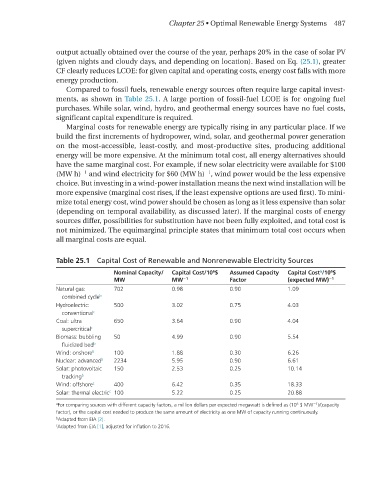
Compared to fossil fuels, renewable energy sources often require large capital invest-
ments, as shown in Table 25.1. A large portion of fossil-fuel lCoE is for ongoing fuel
purchases. While solar, wind, hydro, and geothermal energy sources have no fuel costs,
significant capital expenditure is required.
Marginal costs for renewable energy are typically rising in any particular place. if we
build the first increments of hydropower, wind, solar, and geothermal power generation
on the most-accessible, least-costly, and most-productive sites, producing additional
energy will be more expensive. At the minimum total cost, all energy alternatives should
have the same marginal cost. For example, if new solar electricity were available for $100
−1
−1
(MW h) and wind electricity for $60 (MW h) , wind power would be the less expensive
choice. But investing in a wind-power installation means the next wind installation will be
more expensive (marginal cost rises, if the least expensive options are used first). To mini-
mize total energy cost, wind power should be chosen as long as it less expensive than solar
(depending on temporal availability, as discussed later). if the marginal costs of energy
sources differ, possibilities for substitution have not been fully exploited, and total cost is
not minimized. The equimarginal principle states that minimum total cost occurs when
all marginal costs are equal.
Table 25.1 Capital Cost of Renewable and Nonrenewable Electricity Sources
6
Nominal Capacity/ Capital Cost/10 $ Assumed Capacity Capital Cost /10 $
6
a
MW MW −1 Factor (expected MW) −1
Natural gas: 702 0.98 0.90 1.09
combined cycle b
Hydroelectric: 500 3.02 0.75 4.03
conventional c
Coal: ultra 650 3.64 0.90 4.04
supercritical c
Biomass: bubbling 50 4.99 0.90 5.54
fluidized bed b
Wind: onshore b 100 1.88 0.30 6.26
Nuclear: advanced b 2234 5.95 0.90 6.61
Solar: photovoltaic 150 2.53 0.25 10.14
tracking b
Wind: offshore c 400 6.42 0.35 18.33
Solar: thermal electric 100 5.22 0.25 20.88
c
−1
6
a For comparing sources with different capacity factors, a million dollars per expected megawatt is defined as (10 $ MW )/(capacity
factor), or the capital cost needed to produce the same amount of electricity as one MW of capacity running continuously.
b Adapted from EIA [2].
c Adapted from EIA [1], adjusted for inflation to 2016.