
Page 475 - A Comprehensive Guide to Solar Energy Systems
P. 475
488 A CoMPrEhEnsiVE GUidE To solAr EnErGy sysTEMs
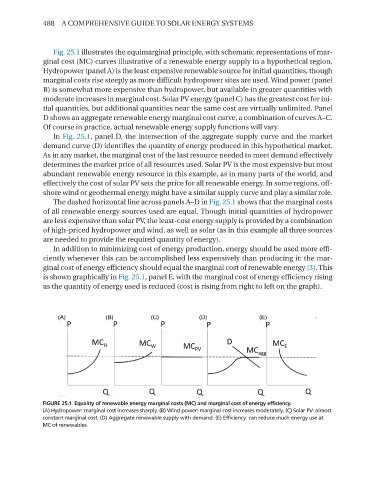
Fig. 25.1 illustrates the equimarginal principle, with schematic representations of mar-
ginal cost (MC) curves illustrative of a renewable energy supply in a hypothetical region.
hydropower (panel A) is the least expensive renewable source for initial quantities, though
marginal costs rise steeply as more difficult hydropower sites are used. Wind power (panel
B) is somewhat more expensive than hydropower, but available in greater quantities with
moderate increases in marginal cost. solar PV energy (panel C) has the greatest cost for ini-
tial quantities, but additional quantities near the same cost are virtually unlimited. Panel
d shows an aggregate renewable energy marginal cost curve, a combination of curves A–C.
of course in practice, actual renewable energy supply functions will vary.
in Fig. 25.1, panel d, the intersection of the aggregate supply curve and the market
demand curve (d) identifies the quantity of energy produced in this hypothetical market.
As in any market, the marginal cost of the last resource needed to meet demand effectively
determines the market price of all resources used. solar PV is the most expensive but most
abundant renewable energy resource in this example, as in many parts of the world, and
effectively the cost of solar PV sets the price for all renewable energy. in some regions, off-
shore wind or geothermal energy might have a similar supply curve and play a similar role.
The dashed horizontal line across panels A–d in Fig. 25.1 shows that the marginal costs
of all renewable energy sources used are equal. Though initial quantities of hydropower
are less expensive than solar PV, the least-cost energy supply is provided by a combination
of high-priced hydropower and wind, as well as solar (as in this example all three sources
are needed to provide the required quantity of energy).
in addition to minimizing cost of energy production, energy should be used more effi-
ciently whenever this can be accomplished less expensively than producing it: the mar-
ginal cost of energy efficiency should equal the marginal cost of renewable energy [3]. This
is shown graphically in Fig. 25.1, panel E, with the marginal cost of energy efficiency rising
as the quantity of energy used is reduced (cost is rising from right to left on the graph).
FIGURE 25.1 Equality of renewable energy marginal costs (MC) and marginal cost of energy efficiency.
(A) Hydropower: marginal cost increases sharply. (B) Wind power: marginal cost increases moderately. (C) Solar PV: almost
constant marginal cost. (D) Aggregate renewable supply with demand. (E) Efficiency: can reduce much energy use at
MC of renewables.