Page 485 - A Comprehensive Guide to Solar Energy Systems
P. 485

498  A CoMPrEhEnsiVE GUidE To solAr EnErGy sysTEMs


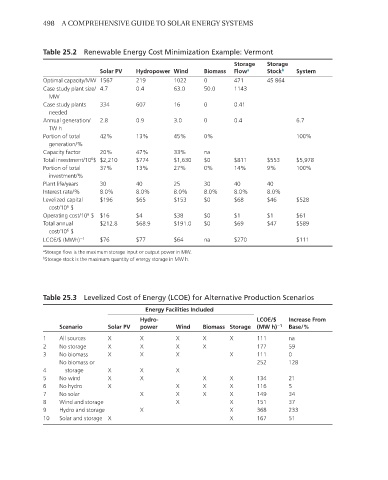
             Table 25.2  Renewable Energy Cost Minimization Example: Vermont
                                                                  Storage   Storage
                             Solar PV  Hydropower Wind    Biomass  Flow a  Stock b  System
             Optimal capacity/MW 1567  219       1022     0       471      45 864
             Case study plant size/ 4.7  0.4     63.0     50.0    1143
               MW
             Case study plants   334   607       16       0       0.41
               needed
             Annual generation/  2.8   0.9       3.0      0       0.4              6.7
               TW h
             Portion of total   42%    13%       45%      0%                       100%
               generation/%
             Capacity factor  20%      47%       33%      na
             Total investment/10 $ $2,210  $774  $1,630   $0      $811     $553    $5,978
                          6
             Portion of total   37%    13%       27%      0%      14%      9%      100%
               investment/%
             Plant life/years  30      40        25       30      40       40
             Interest rate/%  8.0%     8.0%      8.0%     8.0%    8.0%     8.0%
             Levelized capital   $196  $65       $153     $0      $68      $46     $528
               cost/10  $
                    6
             Operating cost/10  $ $16  $4        $38      $0      $1       $1      $61
                         6
             Total annual    $212.8    $68.9     $191.0   $0      $69      $47     $589
                    6
               cost/10  $
             LCOE/$ (MWh) −1  $76      $77       $64      na      $270             $111
             a Storage flow is the maximum storage input or output power in MW.
             b Storage stock is the maximum quantity of energy storage in MW h.


             Table 25.3  Levelized Cost of Energy (LCOE) for Alternative Production Scenarios
                                         Energy Facilities Included
                                        Hydro-                          LCOE/$   Increase From
                  Scenario     Solar PV  power    Wind   Biomass Storage  (MW h) −1  Base/%
             1    All sources  X        X         X      X       X      111      na
             2    No storage   X        X         X      X              177      59
             3    No biomass   X        X         X              X      111      0
                  No biomass or                                         252      128
             4     storage     X        X         X
             5    No wind      X        X                X       X      134      21
             6    No hydro     X                  X      X       X      116      5
             7    No solar              X         X      X       X      149      34
             8    Wind and storage                X              X      151      37
             9    Hydro and storage     X                        X      368      233
             10   Solar and storage X                            X      167      51
   480   481   482   483   484   485   486   487   488   489   490