
Page 382 - A First Course In Stochastic Models
P. 382
MULTI-SERVER QUEUES WITH POISSON INPUT 377
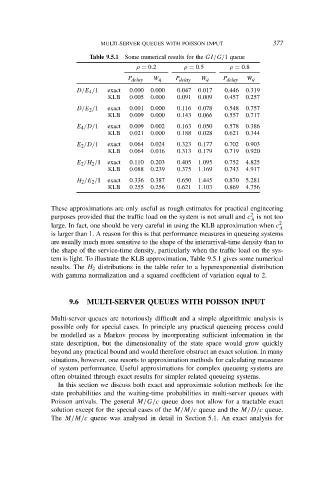
Table 9.5.1 Some numerical results for the GI/G/1 queue
ρ = 0.2 ρ = 0.5 ρ = 0.8
P delay W q P delay W q P delay W q
D/E 4 /1 exact 0.000 0.000 0.047 0.017 0.446 0.319
KLB 0.005 0.000 0.091 0.009 0.457 0.257
D/E 2 /1 exact 0.001 0.000 0.116 0.078 0.548 0.757
KLB 0.009 0.000 0.143 0.066 0.557 0.717
E 4 /D/1 exact 0.009 0.002 0.163 0.050 0.578 0.386
KLB 0.021 0.000 0.188 0.028 0.621 0.344
E 2 /D/1 exact 0.064 0.024 0.323 0.177 0.702 0.903
KLB 0.064 0.016 0.313 0.179 0.719 0.920
E 2 /H 2 /1 exact 0.110 0.203 0.405 1.095 0.752 4.825
KLB 0.088 0.239 0.375 1.169 0.743 4.917
H 2 /E 2 /1 exact 0.336 0.387 0.650 1.445 0.870 5.281
KLB 0.255 0.256 0.621 1.103 0.869 4.756
These approximations are only useful as rough estimates for practical engineering
2
purposes provided that the traffic load on the system is not small and c is not too
A
large. In fact, one should be very careful in using the KLB approximation when c 2
A
is larger than 1. A reason for this is that performance measures in queueing systems
are usually much more sensitive to the shape of the interarrival-time density than to
the shape of the service-time density, particularly when the traffic load on the sys-
tem is light. To illustrate the KLB approximation, Table 9.5.1 gives some numerical
results. The H 2 distributions in the table refer to a hyperexponential distribution
with gamma normalization and a squared coefficient of variation equal to 2.
9.6 MULTI-SERVER QUEUES WITH POISSON INPUT
Multi-server queues are notoriously difficult and a simple algorithmic analysis is
possible only for special cases. In principle any practical queueing process could
be modelled as a Markov process by incorporating sufficient information in the
state description, but the dimensionality of the state space would grow quickly
beyond any practical bound and would therefore obstruct an exact solution. In many
situations, however, one resorts to approximation methods for calculating measures
of system performance. Useful approximations for complex queueing systems are
often obtained through exact results for simpler related queueing systems.
In this section we discuss both exact and approximate solution methods for the
state probabilities and the waiting-time probabilities in multi-server queues with
Poisson arrivals. The general M/G/c queue does not allow for a tractable exact
solution except for the special cases of the M/M/c queue and the M/D/c queue.
The M/M/c queue was analysed in detail in Section 5.1. An exact analysis for