
Page 100 - A Guide to MATLAB for Beginners and Experienced Users
P. 100
Customizing and Manipulating Graphics 81
Here we would probably want the tick marks on the x axis located at mul-
tiples of π. This can be done with the set command applied to the properties
of the axes (and/or by selecting Edit : Axes Properties... in MATLAB 6,
or Tools : Axes Properties... in MATLAB 5.3). The command set is used
to change various properties of graphics. To apply it to “Axes”, it has to be
combined withthe command gca, which stands for “get current axes”. The
code
>> set(gca, ’XTick’, (-2:2)*pi, ’XTickLabel’,...
’-2pi|-pi|0|pi|2pi’)
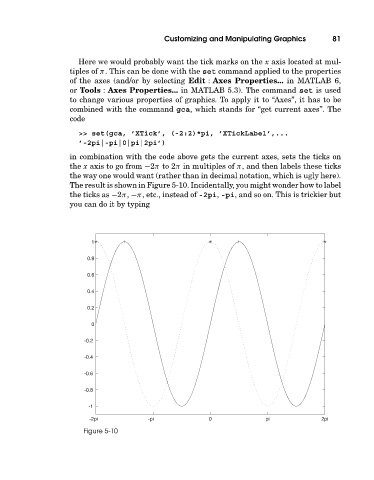
in combination with the code above gets the current axes, sets the ticks on
the x axis to go from −2π to 2π in multiples of π, and then labels these ticks
the way one would want (rather than in decimal notation, which is ugly here).
The result is shown in Figure 5-10. Incidentally, you might wonder how to label
the ticks as −2π, −π, etc., instead of -2pi, -pi, and so on. This is trickier but
you can do it by typing
1
0.8
0.6
0.4
0.2
0
-0.2
-0.4
-0.6
-0.8
-1
-2pi -pi 0 pi 2pi
Figure 5-10