
Page 103 - A Guide to MATLAB for Beginners and Experienced Users
P. 103
84 Chapter 5: MATLAB Graphics
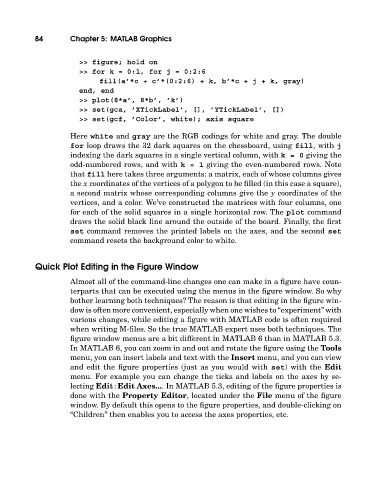
>> figure; hold on
>> for k = 0:1, for j = 0:2:6
fill(a’*c + c’*(0:2:6) + k, b’*c+j+k, gray)
end, end
>> plot(8*a’, 8*b’, ’k’)
>> set(gca, ’XTickLabel’, [], ’YTickLabel’, [])
>> set(gcf, ’Color’, white); axis square
Here white and gray are the RGB codings for white and gray. The double
for loop draws the 32 dark squares on the chessboard, using fill, with j
indexing the dark squares in a single vertical column, with k=0 giving the
odd-numbered rows, and with k=1 giving the even-numbered rows. Note
that fill here takes three arguments: a matrix, each of whose columns gives
the x coordinates of the vertices of a polygon to be filled (in this case a square),
a second matrix whose corresponding columns give the y coordinates of the
vertices, and a color. We’ve constructed the matrices with four columns, one
for each of the solid squares in a single horizontal row. The plot command
draws the solid black line around the outside of the board. Finally, the first
set command removes the printed labels on the axes, and the second set
command resets the background color to white.
Quick Plot Editing in the Figure Window
Almost all of the command-line changes one can make in a figure have coun-
terparts that can be executed using the menus in the figure window. So why
bother learning both techniques? The reason is that editing in the figure win-
dow is often more convenient, especially when one wishes to “experiment” with
various changes, while editing a figure with MATLAB code is often required
when writing M-files. So the true MATLAB expert uses both techniques. The
figure window menus are a bit different in MATLAB 6 than in MATLAB 5.3.
In MATLAB 6, you can zoom in and out and rotate the figure using the Tools
menu, you can insert labels and text withthe Insert menu, and you can view
and edit the figure properties (just as you would with set) withthe Edit
menu. For example you can change the ticks and labels on the axes by se-
lecting Edit : Edit Axes.... In MATLAB 5.3, editing of the figure properties is
done withthe Property Editor, located under the File menu of the figure
window. By default this opens to the figure properties, and double-clicking on
“Children” then enables you to access the axes properties, etc.