
Page 46 - A Guide to MATLAB for Beginners and Experienced Users
P. 46
Graphics 27
2
x + x + 1
7
6
5
4
3
2
1
-2 -1.5 -1 -0.5 0 0.5 1 1.5 2
x
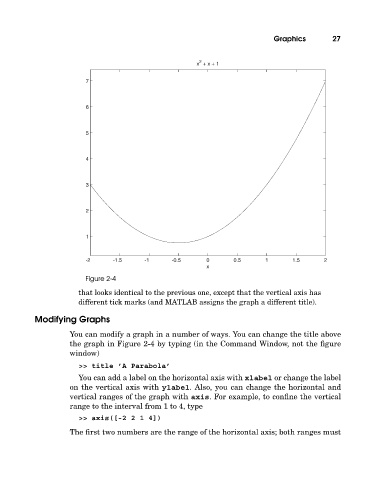
Figure 2-4
that looks identical to the previous one, except that the vertical axis has
different tick marks (and MATLAB assigns the graph a different title).
Modifying Graphs
You can modify a graph in a number of ways. You can change the title above
the graph in Figure 2-4 by typing (in the Command Window, not the figure
window)
>> title ’A Parabola’
You can add a label on the horizontal axis with xlabel or change the label
on the vertical axis with ylabel. Also, you can change the horizontal and
vertical ranges of the graph with axis. For example, to confine the vertical
range to the interval from 1 to 4, type
>> axis([-2 2 1 4])
The first two numbers are the range of the horizontal axis; both ranges must