
Page 53 - Hybrid Enhanced Oil Recovery Using Smart Waterflooding
P. 53
CHAPTER 3 Modeling of Low-Salinity and Smart Waterflood 45
modeling of aqueous solubility of CO 2 . The solubility
1
of CO 2 in water is not calculated by thermodynamic F IF ¼ F IF b Ca ; b Mg ¼ (3.46)
modeling, and some CO 2 is assumed to be dissolved 1 þ am b Ca ; b Mg
in water. With this assumption, the dissolved CO 2 in m b Ca ; b Mg ¼ max½b Ca ðt ¼ 0Þ b Ca ðt > 0Þ; 0
water participates in the aqueous and mineral reactions. þ max b Mg ðt ¼ 0Þ b Mg ðt > 0Þ; 0 (3.47)
In terms of wettability modification modeling, the
study adopted an approach following the MIE mecha- where b Ca and b Mg indicate the desorbed Ca 2þ and
2þ
nism, which is assumed to modify relative permeability Mg , a is the constant, t is the time, and m(b Ca , b Mg )
2þ
through the ion-exchange reaction. The injection of is the amount of the desorbed Ca 2þ and Mg .
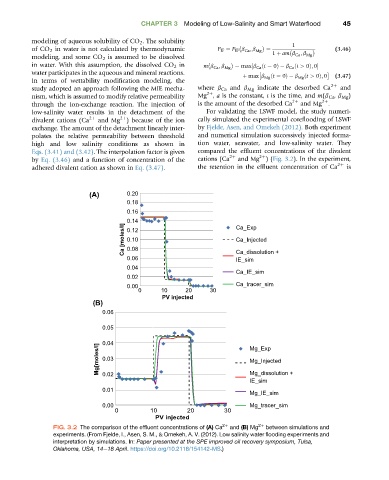
low-salinity water results in the detachment of the For validating the LSWF model, the study numeri-
divalent cations (Ca 2þ and Mg ) because of the ion cally simulated the experimental coreflooding of LSWF
2þ
exchange. The amount of the detachment linearly inter- by Fjelde, Asen, and Omekeh (2012). Both experiment
polates the relative permeability between threshold and numerical simulation successively injected forma-
high and low salinity conditions as shown in tion water, seawater, and low-salinity water. They
Eqs. (3.41) and (3.42). The interpolation factor is given compared the effluent concentrations of the divalent
2þ
by Eq. (3.46) and a function of concentration of the cations (Ca 2þ and Mg )(Fig. 3.2). In the experiment,
adhered divalent cation as shown in Eq. (3.47). the retention in the effluent concentration of Ca 2þ is
(A) 0.20
0.18
0.16
0.14 Ca_Exp
Ca [moles/l] 0.12 Ca_Injected
0.10
0.08
0.06 Ca_dissolution +
IE_sim
0.04
Ca_IE_sim
0.02
Ca_tracer_sim
0.00
0 10 20 30
PV injected
(B)
0.06
0.05
0.04 Mg_Exp
Mg[moles/l] 0.03 Mg_Injected
Mg_dissolution +
0.02
IE_sim
0.01
Mg_IE_sim
0.00 Mg_tracer_sim
0 10 20 30
PV injected
FIG. 3.2 The comparison of the effluent concentrations of (A) Ca 2þ and (B) Mg 2þ between simulations and
experiments. (From Fjelde, I., Asen, S. M., & Omekeh, A. V. (2012). Low salinity water flooding experiments and
interpretation by simulations. In: Paper presented at the SPE improved oil recovery symposium, Tulsa,
Oklahoma, USA, 14e18 April. https://doi.org/10.2118/154142-MS.)