
Page 55 - Hybrid Enhanced Oil Recovery Using Smart Waterflooding
P. 55
CHAPTER 3 Modeling of Low-Salinity and Smart Waterflood 47
and geochemical reactions is carried out. The study
ln H s ¼ ln p s þ 9:4234 T r;H 2 O 1
CO 2 H 2 O simulated the injection of low-salinity water into
0:355 1
þ 4:0087 1 T r;H 2 O T r;H 2 O connate water-saturated core system using both simula-
tors of GEM and PHREEQC. It compared the effluent
0:41
þ 10:3199 exp 1 T r;H 2 O T r;H 2 O (3.52) 2þ þ
concentrations of Ca and Na between the GEM
v ¼ 37:51 9:585 10 2 T þ 8:740 10 4 2 and PHREEQC and observed the good match from
T
(3.53) the comparisons. Secondly, the study tested and
5:044 10 7 3
T
validated the numerical model of LSWF by comparing
where T r;H 2 O is the reduced temperature of H 2 O and T is with the experimental results (Fjelde et al., 2012; Rivet,
the temperature ( C). 2009). In the study, numerical simulation agrees the
In addition to the pressure and temperature, wettability modification because of ion exchange as
the salinity of the system also influences the aqueous the main mechanism behind the LSWF. It assumes
solubility of CO 2 . The Henry’s constant varies according and models the wettability modification of LSWF as a
to the salinity of brine. It is reported that the solubility of function of the equivalent fraction of cation. It linearly
the gaseous components generally decreases with interpolates both the oil and water relative permeabil-
increasing salinity. It is known as the salting-out ities between high and low threshold salinity
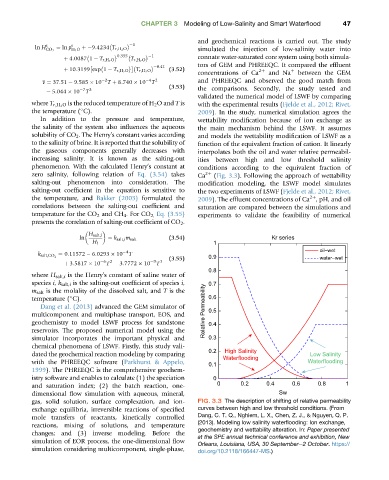
phenomenon. With the calculated Henry’sconstant at conditions according to the equivalent fraction of
zero salinity, following relation of Eq. (3.54) takes Ca 2þ (Fig. 3.3). Following the approach of wettability
salting-out phenomenon into consideration. The modification modeling, the LSWF model simulates
salting-out coefficient in the equation is sensitive to the two experiments of LSWF (Fjelde et al., 2012; Rivet,
the temperature, and Bakker (2003) formulated the 2009). The effluent concentrations of Ca , pH, and oil
2þ
correlations between the salting-out coefficient and saturation are compared between the simulations and
temperature for the CO 2 and CH 4 .For CO 2, Eq. (3.55) experiments to validate the feasibility of numerical
presents the correlation of salting-out coefficient of CO 2 .
H salt;i
ln ¼ k salt;i m salt (3.54) Kr series
H i 1
oil–wet
¼ 0:11572 6:0293 10 4 T
k salt;CO 2 0.9
(3.55) water–wet
þ 3:5817 10 6 2 9 3
T
T 3:7772 10
0.8
where H salt,i is the Henry’s constant of saline water of
species i, k salt,i is the salting-out coefficient of species i, 0.7
m salt is the molality of the dissolved salt, and T is the
temperature ( C). 0.6
Dang et al. (2013) advanced the GEM simulator of 0.5
multicomponent and multiphase transport, EOS, and Relative Permeability
geochemistry to model LSWF process for sandstone 0.4
reservoirs. The proposed numerical model using the
simulator incorporates the important physical and 0.3
chemical phenomena of LSWF. Firstly, this study vali-
0.2 High Salinity
dated the geochemical reaction modeling by comparing Low Salinity
Waterflooding
with the PHREEQC software (Parkhurst & Appelo, Waterflooding
0.1
1999). The PHREEQC is the comprehensive geochem-
istry software and enables to calculate (1) the speciation 0
and saturation index; (2) the batch reaction, one- 0 0.2 0.4 0.6 0.8 1
dimensional flow simulation with aqueous, mineral, Sw
gas, solid solution, surface complexation, and ion- FIG. 3.3 The description of shifting of relative permeability
exchange equilibria, irreversible reactions of specified curves between high and low threshold conditions. (From
mole transfers of reactants, kinetically controlled Dang, C. T. Q., Nghiem, L. X., Chen, Z. J., & Nguyen, Q. P.
reactions, mixing of solutions, and temperature (2013). Modeling low salinity waterflooding: Ion exchange,
changes; and (3) inverse modeling. Before the geochemistry and wettability alteration. In: Paper presented
at the SPE annual technical conference and exhibition, New
simulation of EOR process, the one-dimensional flow Orleans, Louisiana, USA, 30 Septembere2 October. https://
simulation considering multicomponent, single-phase, doi.org/10.2118/166447-MS.)