
Page 105 - A Practical Companion to Reservoir Stimulation
P. 105
PRACTICAL COMPANION TO RESERVOIR STIMULATION
EXAMPLE F-10
current state of the art and is outside the scope of this exercise.
Interpretation of a Long-Flowing, A semilogarithmic plot of Am(p)/q vs. log f as outlined in
Hydraulically Fractured Well
Chapter 11 would suffice.)
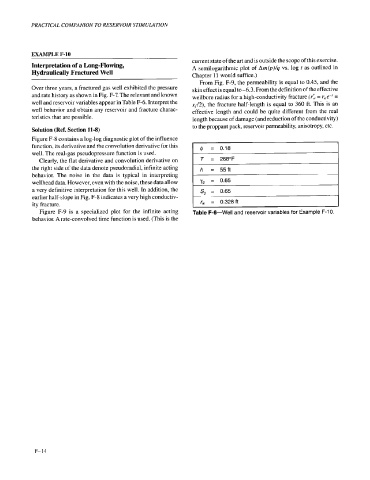
From Fig. F-9, the permeability is equal to 0.45, and the
Over three years, a fractured gas well exhibited the pressure skin effect is equal to-6.3. From the definition of the effective
and rate history as shown in Fig. F-7. The relevant and known wellbore radius for a high-conductivity fracture (rt,, = r, e-' =
well and reservoir variables appear in Table F-6. Interpret the xf/2), the fracture half-length is equal to 360 ft. This is an
well behavior and obtain any reservoir and fracture charac- effective length and could be quite different from the real
teristics that are possible. length because of damage (and reduction of the conductivity)
Solution (Ref. Section 11-8) to the proppant pack, reservoir permeability, anisotropy, etc.
Figure F-8 contains a log-log diagnostic plot of the influence
function, its derivative and the convolution derivative for this fi
I b
= 0.18
well. The real-gas pseudopressure function is used.
Clearly, the flat derivative and convolution derivative on
the right side of the data denote pseudoradial, infinite acting
behavior. The noise in the data is typical in interpreting
wellhead data. However, even with the noise, these data allow
a very definitive interpretation for this well. In addition, the S, = 0.65
earlier half-slope in Fig. F-8 indicates a very high conductiv-
ity fracture. I r,,, = 0.328ft
Figure F-9 is a specialized plot for the infinite acting Table F-6-Well and reservoir variables for Example F-10.
behavior. A rate-convolved time function is used. (This is the
F-14