
Page 207 - A Practical Introduction to Optical Mineralogy
P. 207
TRANSMITTED-LIGHT CRYSTALLOGRAPHY INTERFERENCE FIGURES
In convergent light, the path difference produced by the double refrac-
tion of one ray is not equal to the path difference produced by another
ray, and this results in a variation in interference effects across the field.
In biaxial crystals isogyres (dark bands) and isochromatic curves (inter-
ference colours) appear, their behaviour depending upon the orienta-
tion of the crystal plate. Along the optic axes, no path difference occurs
(OA) and the optic axes appear as dark spots. Figure 4.16a shows
isochromatic curves (black) for a path difference of 1A in a section cut
normal to Bxa and Figure 4.16b shows the same curves in a thicker
section. A set of curves mark loci of sets of points of emergence of
components with a path difference of 1.\. The 'bright' curves between
them are due to fractional path differences which occur within the centre
of each ' bright' curve and correspond to a path difference of mA/2, m
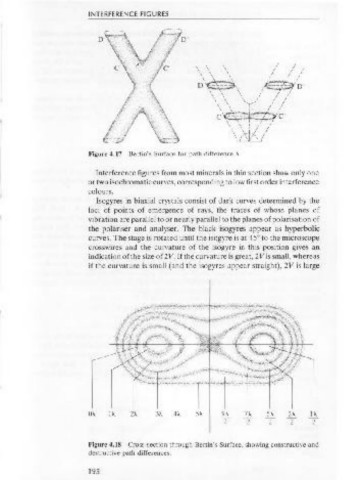
odd. Figure 4.17 Bertin's Surface for path difference A.
These curves represent a slice through a three dimensional surface
(known as Bertin's Surface) which is shown for a path difference of lAin Interference figures from most minerals in thin section show only one
Figure 4.17, with sections across it at various points. Other surfaces exist or two isochromatic curves, corresponding to low first order interference
for different values of mA/2, and a cross section through a set of these colours.
surfaces is shown in Figure 4.18; the cross section is perpendicular to Isogyres in biaxial crystals consist of dark curves determined by the
Bxa and both optic axes are seen. loci of points of emergence of rays, the traces of whose planes of
vibration are parallel to or nearly parallel to the planes of polarisation of
(a) the polariser and analyser. The black isogyres appear as hyperbolic
curves. The stage is rotated until the isogyre is at 45° to the microscope
~ indication of the size of 2V. If the curvature is great, 2V is small, whereas
crosswires and the curvature of the isogyre in this position gives an
if the curvature is small (and the isogyres appear straight), 2V is large
...
OA
(b)
OA lA 2A 3A 4A SA 9A 7A SA 3A lA
2 2 2 2 2
OA lA
Figure 4.16 Isochromatic curves for path difference A: (a) for section normal to Figure 4.18 Cross-section through Bertin's Surface, showing constructive and
Bx.; (b) for thicker section.
destructive path differences.
194 195