
Page 101 - Accounting Best Practices
P. 101
c05.qxd 7/31/03 1:39 PM Page 90
Budgeting Best Practices
90
result in machine utilization levels that are too high to maintain—has anyone
thought of adding machinery purchases to the budget? This problem can be
turned around and dealt with from the point of view of planned expense reduc-
tions, too—if the percentage of direct labor is budgeted to decline due to the use
of automation, has anyone included the cost of the automation in the budget, and
has a suitable time lag been built into the plan to account for the ramp-up time
needed to implement the automation? Some of these problems are present in all
but the best budget models.
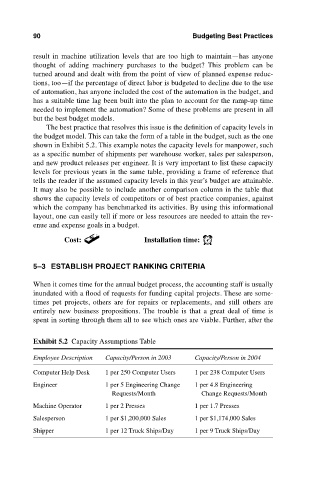
The best practice that resolves this issue is the definition of capacity levels in
the budget model. This can take the form of a table in the budget, such as the one
shown in Exhibit 5.2. This example notes the capacity levels for manpower, such
as a specific number of shipments per warehouse worker, sales per salesperson,
and new product releases per engineer. It is very important to list these capacity
levels for previous years in the same table, providing a frame of reference that
tells the reader if the assumed capacity levels in this year’s budget are attainable.
It may also be possible to include another comparison column in the table that
shows the capacity levels of competitors or of best practice companies, against
which the company has benchmarked its activities. By using this informational
layout, one can easily tell if more or less resources are needed to attain the rev-
enue and expense goals in a budget.
Cost: Installation time:
5–3 ESTABLISH PROJECT RANKING CRITERIA
When it comes time for the annual budget process, the accounting staff is usually
inundated with a flood of requests for funding capital projects. These are some-
times pet projects, others are for repairs or replacements, and still others are
entirely new business propositions. The trouble is that a great deal of time is
spent in sorting through them all to see which ones are viable. Further, after the
Exhibit 5.2 Capacity Assumptions Table
Employee Description Capacity/Person in 2003 Capacity/Person in 2004
Computer Help Desk 1 per 250 Computer Users 1 per 238 Computer Users
Engineer 1 per 5 Engineering Change 1 per 4.8 Engineering
Requests/Month Change Requests/Month
Machine Operator 1 per 2 Presses 1 per 1.7 Presses
Salesperson 1 per $1,200,000 Sales 1 per $1,174,000 Sales
Shipper 1 per 12 Truck Ships/Day 1 per 9 Truck Ships/Day