
Page 182 - Acquisition and Processing of Marine Seismic Data
P. 182
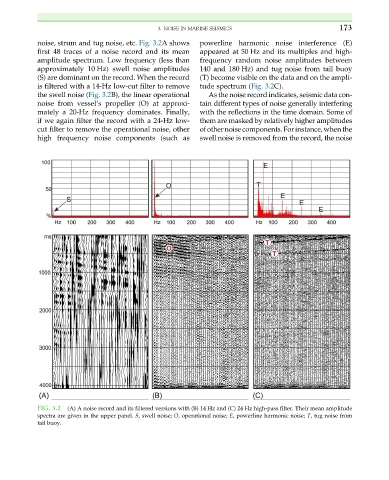
3. NOISE IN MARINE SEISMICS                       173

           noise, strum and tug noise, etc. Fig. 3.2A shows  powerline harmonic noise interference (E)
           first 48 traces of a noise record and its mean  appeared at 50 Hz and its multiples and high-
           amplitude spectrum. Low frequency (less than  frequency random noise amplitudes between
           approximately 10 Hz) swell noise amplitudes  140 and 180 Hz) and tug noise from tail buoy
           (S) are dominant on the record. When the record  (T) become visible on the data and on the ampli-
           is filtered with a 14-Hz low-cut filter to remove  tude spectrum (Fig. 3.2C).
           the swell noise (Fig. 3.2B), the linear operational  As the noise record indicates, seismic data con-
           noise from vessel’s propeller (O) at approxi-  tain different types of noise generally interfering
           mately a 20-Hz frequency dominates. Finally,  with the reflections in the time domain. Some of
           if we again filter the record with a 24-Hz low-  them are masked by relatively higher amplitudes
           cut filter to remove the operational noise, other  of othernoise components.For instance, whenthe
           high frequency noise components (such as     swell noise is removed from the record, the noise


           FIG. 3.2  (A) A noise record and its filtered versions with (B) 14 Hz and (C) 24 Hz high-pass filter. Their mean amplitude
           spectra are given in the upper panel. S, swell noise; O, operational noise; E, powerline harmonic noise; T, tug noise from
           tail buoy.