
Page 192 - Acquisition and Processing of Marine Seismic Data
P. 192
3.5 BIRD NOISE 183
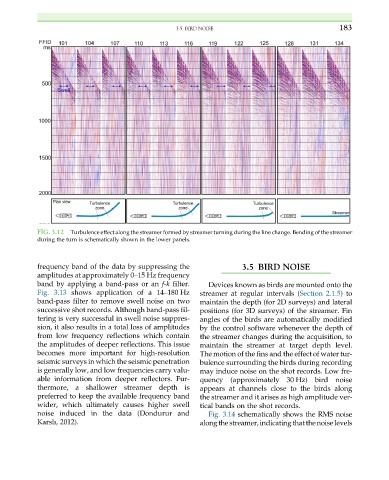
FIG. 3.12 Turbulence effect along the streamer formed by streamer turning during the line change. Bending of the streamer
during the turn is schematically shown in the lower panels.
frequency band of the data by suppressing the 3.5 BIRD NOISE
amplitudes at approximately 0–15 Hz frequency
band by applying a band-pass or an f-k filter. Devices known as birds are mounted onto the
Fig. 3.13 shows application of a 14–180 Hz streamer at regular intervals (Section 2.1.5)to
band-pass filter to remove swell noise on two maintain the depth (for 2D surveys) and lateral
successive shot records. Although band-pass fil- positions (for 3D surveys) of the streamer. Fin
tering is very successful in swell noise suppres- angles of the birds are automatically modified
sion, it also results in a total loss of amplitudes by the control software whenever the depth of
from low frequency reflections which contain the streamer changes during the acquisition, to
the amplitudes of deeper reflections. This issue maintain the streamer at target depth level.
becomes more important for high-resolution The motion of the fins and the effect of water tur-
seismic surveys in which the seismic penetration bulence surrounding the birds during recording
is generally low, and low frequencies carry valu- may induce noise on the shot records. Low fre-
able information from deeper reflectors. Fur- quency (approximately 30 Hz) bird noise
thermore, a shallower streamer depth is appears at channels close to the birds along
preferred to keep the available frequency band the streamer and it arises as high amplitude ver-
wider, which ultimately causes higher swell tical bands on the shot records.
noise induced in the data (Dondurur and Fig. 3.14 schematically shows the RMS noise
Karslı, 2012). along the streamer, indicating that the noise levels