
Page 438 - Acquisition and Processing of Marine Seismic Data
P. 438
9.2 VELOCITY DETERMINATION FROM SEISMIC DATA 429
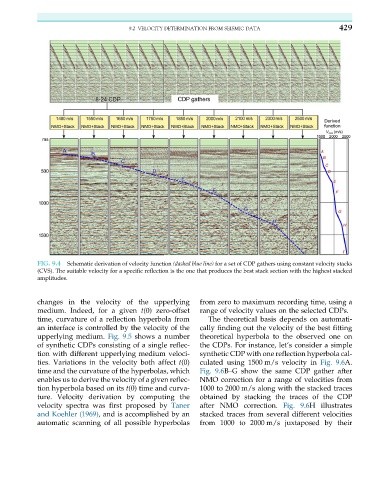
FIG. 9.4 Schematic derivation of velocity function (dashed blue line) for a set of CDP gathers using constant velocity stacks
(CVS). The suitable velocity for a specific reflection is the one that produces the best stack section with the highest stacked
amplitudes.
changes in the velocity of the upperlying from zero to maximum recording time, using a
medium. Indeed, for a given t(0) zero-offset range of velocity values on the selected CDPs.
time, curvature of a reflection hyperbola from The theoretical basis depends on automati-
an interface is controlled by the velocity of the cally finding out the velocity of the best fitting
upperlying medium. Fig. 9.5 shows a number theoretical hyperbola to the observed one on
of synthetic CDPs consisting of a single reflec- the CDPs. For instance, let’s consider a simple
tion with different upperlying medium veloci- synthetic CDP with one reflection hyperbola cal-
ties. Variations in the velocity both affect t(0) culated using 1500 m/s velocity in Fig. 9.6A.
time and the curvature of the hyperbolas, which Fig. 9.6B–G show the same CDP gather after
enables us to derive the velocity of a given reflec- NMO correction for a range of velocities from
tion hyperbola based on its t(0) time and curva- 1000 to 2000 m/s along with the stacked traces
ture. Velocity derivation by computing the obtained by stacking the traces of the CDP
velocity spectra was first proposed by Taner after NMO correction. Fig. 9.6H illustrates
and Koehler (1969), and is accomplished by an stacked traces from several different velocities
automatic scanning of all possible hyperbolas from 1000 to 2000 m/s juxtaposed by their