
Page 211 - Adsorbents fundamentals and applications
P. 211
196 π-COMPLEXATION SORBENTS AND APPLICATIONS
◦
200 C, followed by incipient wetness impregnation with an aqueous solution
of CuCl 2 and ammonium citrate. For each kilogram of alumina, 0.49 liters of
aqueous solution containing 0.31 kg CuCl 2 · 2H 2 O and 0.0375 kg ammonium
◦
citrate was used. The resulting material was air-dried at 120 C, followed by acti-
◦
vating at 200 C in nitrogen. The pore volume of activated alumina is generally
3
near 0.3–0.4 cm /g (Figure 5.1). Hence the volume of the solution was in excess
3
of the pore volume, since 0.49 cm /g of solution was used. For the activated car-
bon support, the sample was first pre-oxidized in wet (at 20% relative humidity)
3
◦
air at 120 C. The pore volume of activated carbon is ∼0.6 cm /g (Figure 5.1).
Again, an excessive volume of aqueous solution was used. For each kilogram of
activated carbon, 1 liter of aqueous solution containing 0.7 kg CuCl 2 · 2H 2 Oand
0.05 kg ammonium citrate was used. The resulting material was subjected to the
same post-treatment as that used for the activated alumina sample.
◦
The final activation step (i.e., in N 2 at 200 C) described above (Golden et al.,
1992a) was not adequate to fully reduce Cu 2+ to Cu . A mixture of 25% CO and
+
75% H 2 was subsequently used as the reducing gas in the final reduction step
(Golden et al., 1992b). Copper in the reduced states, with a valence of 1 or 0, can
form π-complexation bonding with CO, while Cu 2+ cannot form chemical bond
with CO. Therefore, the extent of reduction can be measured by CO adsorption.
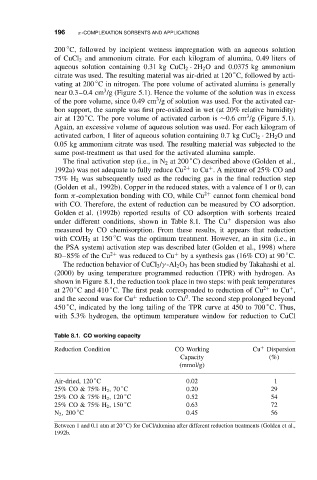
Golden et al. (1992b) reported results of CO adsorption with sorbents treated
under different conditions, shown in Table 8.1. The Cu + dispersion was also
measured by CO chemisorption. From these results, it appears that reduction
◦
with CO/H 2 at 150 C was the optimum treatment. However, an in situ (i.e., in
the PSA system) activation step was described later (Golden et al., 1998) where
◦
+
80–85% of the Cu 2+ was reduced to Cu by a synthesis gas (16% CO) at 90 C.
The reduction behavior of CuCl 2 /γ -Al 2 O 3 has been studied by Takahashi et al.
(2000) by using temperature programmed reduction (TPR) with hydrogen. As
shown in Figure 8.1, the reduction took place in two steps: with peak temperatures
◦
◦
at 270 C and 410 C. The first peak corresponded to reduction of Cu 2+ to Cu ,
+
0
+
and the second was for Cu reduction to Cu . The second step prolonged beyond
◦
◦
450 C, indicated by the long tailing of the TPR curve at 450 to 700 C. Thus,
with 5.3% hydrogen, the optimum temperature window for reduction to CuCl
Table 8.1. CO working capacity
Reduction Condition CO Working Cu Dispersion
+
Capacity (%)
(mmol/g)
◦
Air-dried, 120 C 0.02 1
◦
25% CO & 75% H 2 ,70 C 0.20 29
◦
25% CO & 75% H 2 , 120 C 0.52 54
◦
25% CO & 75% H 2 , 150 C 0.63 72
◦
N 2 , 200 C 0.45 56
◦
Between 1 and 0.1 atm at 20 C) for CuCl/alumina after different reduction treatments (Golden et al.,
1992b.