
Page 105 - Adsorption by Powders and Porous Solids
P. 105
ADSORPTION BY POWDERS AND POROUS SOLIDS
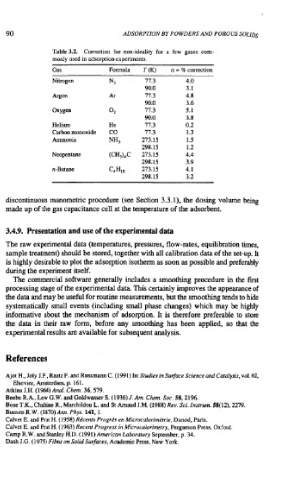
Table 3.2. Correction for non-ideality for a few gases com-
monly used in adsorption experiments.
Gas Fonnula T (K) a = % correction
Nitrogen N2 77.3 4.0
90.0 3.1
Argon Ar 77.3 4.8
90.0 3.6
Oxygen 02 77.3 5.1
90.0 3.8
Helium He 77.3 0.2
Carbon monoxide CO 77.3 1.3
Ammonia NH3 273.15 1.5
298.15 1.2
Neopentane (CH3),C 273.15 4.4
298.15 3.9
n-Butane C,H,, 273.15 4.1
298.15 3.2
discontinuous manometric procedure (see Section 3.3.1). the dosing volume being
made up of the gas capacitance cell at the temperature of the adsorbent.
3.4.9. Presentation and use of the experimental data
The raw experimental data (temperatures, pressures, flow-rates, equilibration times,
sample treatment) should be stored, together with all calibration data of the set-up. It
is highly desirable to plot the adsorption isotherm as soon as possible and preferably
during the experiment itself.
The commercial software generally includes a smoothing procedure in the first
processing stage of the experimental data. This certainly improves the appearance of
the data and may be useful for routine measurements, but the smoothing tends to hide
systematically small events (including small phase changes) which may be highly
informative about the mechanism of adsorption. It is therefore preferable to store
the data in their raw form, before any smoothing has been applied, so that the
experimental results are available for subsequent analysis.
References
Ajot H., Joly J.F., Raatz F. and Russmann C. (1991) In: Studies insurface Science and Catalysis, vol. 62,
Elsevier, Amsterdam, p. 161.
Atkins J.H. (1964) Aml. Chem. 36,579.
Beebe R.A., Low G.W. andGoldwasser S. (1936) 1. Am. Chem. Soc. 58,2196.
Bose T.K., Chahie R., Marchildon L. and St Amaud J.M. (1988) Rev. Sci. Instrwn. 58(12), 2279.
Bunsen R.W. (1870) Am. Phys 141, 1.
Calvet E. and Pnt H. (1958) Rdcents Progrks en Microcalorimetrie, Dunod. Paris.
Calvet E. and Rat H. (1963) Recent Progress in Microcalorimetry, Pergamon Press, Oxford.
Camp R.W. andstanley H.D. (1991) American Labormory September, p. 34.
Dash J.G. (197511 Films on Solid Surfaces, Academic Press, New York.