
Page 197 - Adsorption by Powders and Porous Solids
P. 197
184 ADSORPTION BY POWDERS AND POROUS SOUQ
such as
N =b-Dh
m (6.29)
where Nm is the number of molecules in the completed monolayer, a is the adsorptive
molecular area and D, is now the fractal dimension of the accessible surface (F*
and Avnir, 1989).
The magnitude of Da is determined inter alia by the degree of surface roughness
porosity. In principle, a lower limit of Da = 2 is obtained with a perfectly smooth surface
on the molecular scale. Most non-porous materials would be expected to exhibit sorne
surface roughness. With such a material, a constant value of D, between 2 and 3 implies
that there is a degree of self-similarity: the shape of the surface irregularities thus
remains invariant over a certain range of resolution. The physical structure of a fractal
surface will therefore appear similar when viewed at different magnifications.
Fractal plots of log n, versus log a for two porous silicas are shown in Figure 6.3
(here, n, is the BET monolayer capacity). Both plots are linear, giving D, = 2.98 for
the silica gel and D, = 2.09 for the controlled pore glass. These values reflect the
extremes of the fractal scale, the latter being close to the ideal value for a flat surf=,
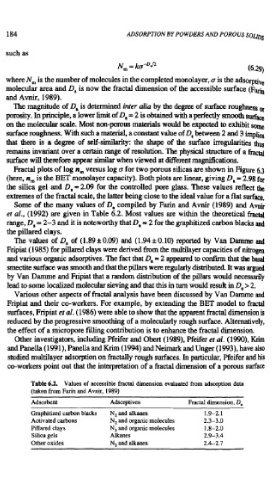
Some of the many values of D, compiled by Farin and Avnir (1989) and Avnir
et al., (1992) are given in Table 6.2. Most values are within the theoretical fractal
range, D, = 2-3 and it is noteworthy that D, = 2 for the graphitized carbon blacks and
the pillared clays.
The values of D, of (1.89 * 0.09) and (1.94 rt 0.10) reported by Van Darnme and
Fripiat (1985) for pill& clays were derived from the multilayer capacities of nitrogen
and various organic adsorptives. The fact that D, 2 appeared to confirm that the basal
smectite surface was smooth and that the pillars were regularly distributed. It was argued
by Van Damrne and Fripiat that a random distribution of the pillars would necessarily
lead to some localized molecular sieving and that this in turn would result in D, > 2.
Various other aspects of fractal analysis have been discussed by Van Damrne and
Fripiat and their co-workers. For example, by extending the BET model to fractal
surfaces, Fripiat et al. (1986) were able to show that the apparent fractal dimension is
reduced by the progressive smoothing of a molecularly rough surface. Alternatively,
the effect of a micropore filling contribution is to enhance the fractal dimension.
Other investigators, including Heifer and Obert (1989), Heifer et al. (1990), Krim
and Panella (1991), Panella and Krim (1994) and Neimark and Unger (1 993), have also
studied multilayer adsorption on fractally rough surfaces. In particular, Heifer and his
co-workers point out that the interpretation of a fractal dimension of a porous surface
Table 6.2. Values of accessible fractal dimension evaluated from adsorption data
(taken from Farin and Avnir, 1989)
Adsorbent Adsorptives Fractal dimension, D,
Graphitized carbon blacks N, and alkanes 1.9-2.1
Activated carbons N, and organic molecules 2.3-3.0
Pillared clays N, and organic molecules 1.8-2.0
Silica gels Alkanes 2.9-3.4
Other oxides N, and alkanes 2.4-2.7