
Page 107 - Adsorption Technology & Design, Elsevier (1998)
P. 107
Processes and cycles 103
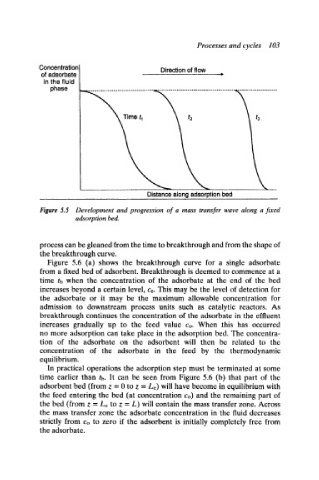
Concentration
Direction of flow
of adsorbate
in the fluid
phase
Distance along adsorption bed
Figure 5.5 Development and progression of a mass transfer wave along a fixed
adsorption bed.
process can be gleaned from the time to breakthrough and from the shape of
the breakthrough curve.
Figure 5.6 (a) shows the breakthrough curve for a single adsorbate
from a fixed bed of adsorbent. Breakthrough is deemed to commence at a
time tb when the concentration of the adsorbate at the end of the bed
increases beyond a certain level, c~. This may be the level of detection for
the adsorbate or it may be the maximum allowable concentration for
admission to downstream process units such as catalytic reactors. As
breakthrough continues the concentration of the adsorbate in the effluent
increases gradually up to the feed value Co. When Ihis has occurred
no more adsorption can take place in the adsorption bed. The concentra-
tion of the adsorbate on the adsorbent will then be related to the
concentration of the adsorbate in the feed by the thermodynamic
equilibrium.
In practical operations the adsorption step must be terminated at some
time earlier than tb. It can be seen from Figure 5.6 (b) that part of the
adsorbent bed (from z = 0 to z = Le) will have become in equilibrium with
the feed entering the bed (at concentration Co) and the remaining part of
the bed (from z = L~ to z = L) will contain the mass transfer zone. Across
the mass transfer zone the adsorbate concentration in the fluid decreases
strictly from Co to zero if the adsorbent is initially completely free from
the adsorbate.