
Page 511 - Advanced Design Examples of Seismic Retrofit of Structures
P. 511
454 Advanced Design Examples of Seismic Retrofit of Structures
1
1
Level 100% Level 125%
0.8 Level 125% 0.8 Level 150%
0.6 0.6 Level 175%
D.I. D.I.
0.4 0.4
0.2 0.2
0 0
1 2 3 4 5 6 7 8 9 10 1 2 3 4 5 6 7 8 9 10
(A) Location (B) Location
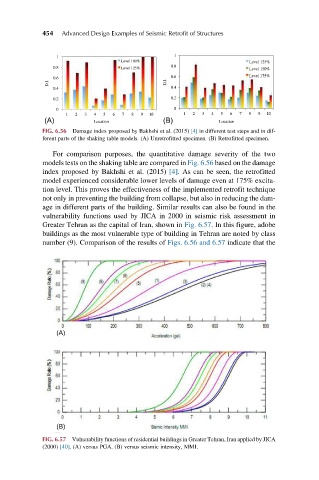
FIG. 6.56 Damage index proposed by Bakhshi et al. (2015) [4] in different test steps and in dif-
ferent parts of the shaking table models. (A) Unretrofitted specimen. (B) Retrofitted specimen.
For comparison purposes, the quantitative damage severity of the two
models tests on the shaking table are compared in Fig. 6.56 based on the damage
index proposed by Bakhshi et al. (2015) [4]. As can be seen, the retrofitted
model experienced considerable lower levels of damage even at 175% excita-
tion level. This proves the effectiveness of the implemented retrofit technique
not only in preventing the building from collapse, but also in reducing the dam-
age in different parts of the building. Similar results can also be found in the
vulnerability functions used by JICA in 2000 in seismic risk assessment in
Greater Tehran as the capital of Iran, shown in Fig. 6.57. In this figure, adobe
buildings as the most vulnerable type of building in Tehran are noted by class
number (9). Comparison of the results of Figs. 6.56 and 6.57 indicate that the
(A)
(B)
FIG. 6.57 Vulnerability functions of residential buildings in Greater Tehran, Iran applied by JICA
(2000) [40]. (A) versus PGA. (B) versus seismic intensity, MMI.