
Page 95 - Advanced Design Examples of Seismic Retrofit of Structures
P. 95
Example of a Two-Story Unreinforced Masonry Building Chapter 2 87
performance-based design is to predict a building’s response accurately during
increasing levels of seismic excitation. With the state-of-the-art capabilities of
numerical simulationand thelargeexperimental data and earthquake fieldobser-
vations, it is now possible to predict accurately many response characteristics of
masonry buildings. In some cases, for example, adobe buildings and historic
structures, for which the current design codes approaches are strength-based if
not silent, the performance levels are usually judged by available test data,
numerical analysis and simple hand calculations (refer to Chapter 6).
These two design strategies are not mutually exclusive: the strength-based
approach addresses the elastic behavior of the structure, while the stability-
based approach addresses the postelastic performance. In fact, the two
approaches can be complementary. The sole use of the strength-based approach
can be justified only when there is a known relationship between the level at
which yielding first occurs and the level at which the structure collapses. In
the case of masonry buildings, there is no clear relationship between these
two events. Some measures that are designed to improve the elastic behavior
of a building may have little or no effect on structural stability during major
seismic events. Yet stability-based retrofitting measures, which may have little
effect on the initiation or prevention of minor cracks, may have a significant
impact on the development of severe damage and on preventing collapse.
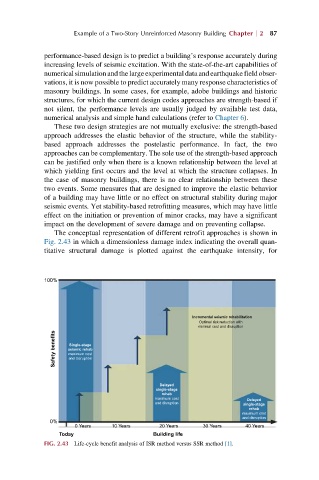
The conceptual representation of different retrofit approaches is shown in
Fig. 2.43 in which a dimensionless damage index indicating the overall quan-
titative structural damage is plotted against the earthquake intensity, for
100%
Incremental seismic rehabilitation
Optimal risk reduction with
minimal cost and disruption
Safety benefits seismic rehab
Single-stage
maximum cost
and disruption
Delayed
single-stage
rehab
maximum cost Delayed
and disruption single-stage
rehab
maximum cost
and disruption
0%
0 Years 10 Years 20 Years 30 Years 40 Years
Today Building life
FIG. 2.43 Life-cycle benefit analysis of ISR method versus SSR method [1].