
Page 28 - Advanced Gas Turbine Cycles
P. 28
Chapter 1. A brief review of power generation thennodynamics 5
is simply the thermal or cycle efficiency,
W
q" -
QB '
where W is the net work output and QB is the heat supplied. Wand QB may be measured for a
mass of fluid (M) that circulates over a given period of time. Thus, the efficiency may also be
expressed in terms of the power output (w and the rate of heat transfer (QB),
w
q= -,
QB
and this formulation is more convenient for a steady flow cycle. In most of the
thermodynamic analyses in this book, we shall work in terms of W, QB and mass flow M (all
measured over a period of time), rather than in terms of the rates W, QB and &f (we call M a
mass flow and M a mass flow rate).
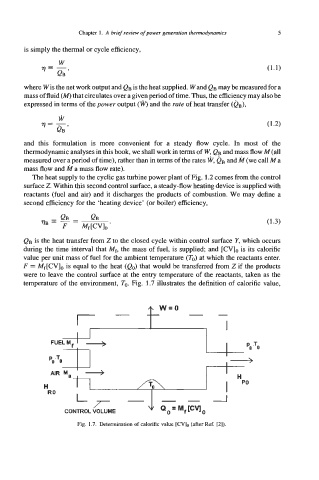
The heat supply to the cyclic gas turbine power plant of Fig. 1.2 comes from the control
surface 2. Within this second control surface, a steady-flow heating device is supplied with
reactants (fuel and air) and it discharges the products of combustion. We may define a
second efficiency for the 'heating device' (or boiler) efficiency,
(1.3)
QB is the heat transfer from 2 to the closed cycle within control surface Y, which occurs
during the time interval that Mf, the mass of fuel, is supplied; and [CV], is its calorific
value per unit mass of fuel for the ambient temperature (To) at which the reactants enter.
F = Mf[CVl0 is equal to the heat (eo) that would be transferred from 2 if the products
were to leave the control surface at the entry temperature of the reactants, taken as the
temperature of the environment, To. Fig. 1.7 illustrates the definition of calorific value,
+ w=o
- - -
I- t I
I
II
I Po -To
H
RO
--I
CONTROL VOLUME Q, = M,[CVlo
Fig. 1.7. Determination of calorific value [CV], (after Ref. [2]).